
TradingView Median Proximity Percentile [AlgoAlpha] Conversion to NinjaTrader 8
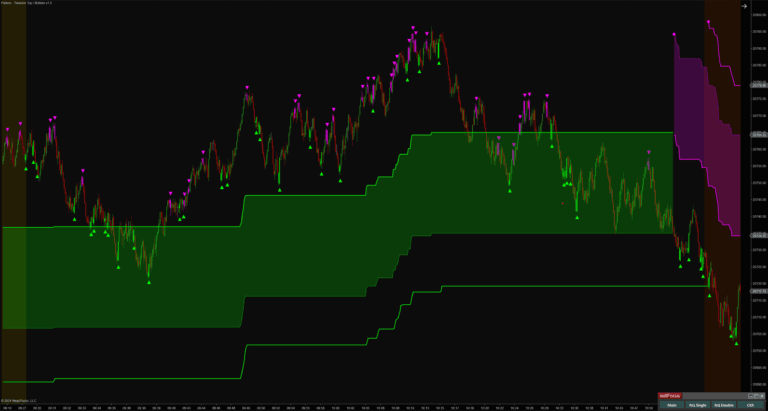
In the ever-evolving landscape of financial markets, traders are constantly on the lookout for tools that can provide them with an edge. The Median Proximity Percentile indicator, developed by AlgoAlpha, is one such tool that has gained attention for its innovative approach to market analysis. This indicator is designed to track the median price proximity over a specified lookback period and assess its position within two dynamic standard deviation bands.
Understanding the Median Proximity Percentile Indicator
At its core, the Median Proximity Percentile indicator leverages statistical methods to provide a visual understanding of where the current price stands in relation to its historical median. By calculating the median price over a chosen lookback period, it sets a baseline for comparison. The real magic, however, lies in how it uses this information to determine the percentile value of the current price within the boundaries defined by standard deviations and a Moving Average of the price deviations.
Key Features of the Indicator
- Color-Coded Visuals: The indicator makes it easy to interpret market trends with its color-coded plots. These visuals indicate bullish or bearish signals based on the position of the market relative to the median price. Clear, visual cues help traders quickly assess market conditions without getting bogged down in numbers.
- Customizability: Traders can customize the price source and the lookback lengths for both the median and HMA calculations. This adaptability allows the indicator to be tailored to fit various trading strategies and timeframes, making it a versatile tool for a wide range of market participants.
Practical Applications in Trading
The Median Proximity Percentile indicator can be used to:
- Identify Entry and Exit Points: By understanding where the price lies within the percentile range, traders can make decisions about potential entry and exit points. For example, a price near the upper boundary might suggest a potential sell-off point, whereas a price near the lower boundary could indicate a buying opportunity.
- Enhance Risk Management: With its ability to forecast potential bullish and bearish reversals, the indicator can help traders manage risk by suggesting when to tighten stops or take profits.
- Combine with Other Analysis Techniques: While powerful on its own, the Median Proximity Percentile indicators best results are when used in conjunction with other analysis techniques. Integrating the indicator into your trading strategy that includes both technical and fundamental analysis can provide a more rounded view of the markets.
Conclusion
The Median Proximity Percentile by AlgoAlpha is an analytical tool that can help traders navigate the complexities of the markets with greater confidence. By providing timely and visually intuitive insights, it can aid in making more informed trading decisions and enhance risk management.
Happy trading!
Download
The original Pine Script™ code was developed by AlgoAlpha: Median Proximity Percentile and converted to NinjaTrader 8 under the Mozilla Public License 2.0 at https://mozilla.org/MPL/2.0/
Download the NinjaTrader 8 (Open Source) Median Proximity Percentile Indicator HERE
🎉 Prop Trading Discounts
💥89% off at Bulenox.com with the code MDT89

![Cosine Kernel Regressions [QuantraSystems] Conversion](https://mydailytake.com/wp-content/uploads/2024/06/CosineKernelRegressions_5-Minute_NQ-768x458.png)


Let me know what other TradingView indicators you are interested in having converted to NinjaTrader