
TradingView Choch Pattern Levels [BigBeluga] Conversion to NinjaTrader 8
A Change-of-Character (CHOCH) is the cleanest tell that price action has shifted regimes — the moment a new high breaks the previous swing high while the trend was down (bullish CHOCH), or a new low breaks the previous swing low while the trend was up (bearish CHOCH). BigBeluga’s Choch Pattern Levels takes that primitive and renders the full pattern: a triangle from the broken pivot to the breakout bar’s high/low to the most extreme low/high in between, plus a horizontal level extending right.
Each triangle is a zone — the level holds until price’s body crosses it on either the current or previous bar, at which point the zone is invalidated and removed. A delta volume label shows the cumulative signed volume across the breakout window, so you can see whether the CHOCH had real participation or printed on thin volume. Active zones are capped at Amount; the oldest is dropped first.
This post is the NinjaTrader 8 conversion. The full source compiles standalone in indTradingView/, draws the triangle zones + horizontal levels on the price panel, and is yours to download as a NinjaScript Archive.
Original Pine Script: Choch Pattern Levels by BigBeluga
License: Attribution-NonCommercial-ShareAlike 4.0 International (CC BY-NC-SA 4.0)
🆚 What Makes Choch Pattern Levels Different
Most CHOCH indicators just print arrows or labels at the structure break. ChoCh Pattern Levels does the geometry: it traces the triangle from the broken pivot, through the breakout bar, to the most-extreme low (for bullish) or high (for bearish) in between. The triangle’s base is the new level — and the level extends right until invalidated.
Triangle zones, not just arrows. The SharpDX PathGeometry triangle fill traces the actual structure. You can see the breakout’s range at a glance, and the bar that produced the extreme low/high is exactly the third vertex.
Per-zone delta volume. Each triangle gets a delta-volume label — sum of (close > open ? +volume : −volume) across the bars from broken pivot through breakout. A CHOCH with positive delta is real participation; a CHOCH with delta near zero is mechanical and may not hold.
Body-cross invalidation. Zones are deleted when the candle BODY (not wick) crosses the level on the current or previous bar. So a wick-only spike doesn’t kill the zone, but a committed close does.
⚙️ Settings
Choch Pattern Levels exposes its inputs in three property groups: the calculation parameters (pivot length and the cap on active zones), the delta-volume label group, and the colors used for the bull and bear triangle zones.
Parameters
| Parameter | Default | Description |
|---|---|---|
| Length | 10 | Pivot left/right window. Higher = fewer / cleaner pivots; lower = more reactive. |
| Amount of Patterns | 10 | Maximum active CHOCH zones held in memory. Oldest dropped when this is exceeded. |
Delta Volume
| Parameter | Default | Description |
|---|---|---|
| Show Delta Volume | True | Render the cumulative delta volume label across each CHOCH window. |
| Delta Text Size | Normal | Font size for the delta volume label. |
Colors
| Parameter | Default | Description |
|---|---|---|
| ChoCh Up Color | Lime | Color for bullish CHOCH triangles + level lines. |
| ChoCh Down Color | Red | Color for bearish CHOCH triangles + level lines. |
🧠 How It Works
Each bar runs a confirmed-pivot scan, then evaluates whether the current bar broke the most recent pivot in the opposite direction.
- Pivot detection. A pivot high is confirmed when the bar Length back has the highest high in a 2 × Length + 1 window centered on it. Pivot lows are symmetric. The most recent confirmed pivot high (ph, phBar) and pivot low (pl, plBar) are tracked across bars.
- CHOCH break. Bullish CHOCH = high crosses above ph while trend is down. Bearish CHOCH = low crosses below pl while trend is up. The trend state flips on the break — so a CHOCH always implies a regime change, not just a level break inside the same trend.
- Triangle geometry. Three vertices: the broken pivot (ph or pl), the breakout bar’s high (bullish) or low (bearish), and the extreme price between them (LOWEST low for bullish, HIGHEST high for bearish). The extreme defines the new horizontal level.
- Level extension. The horizontal level extends right every bar until invalidated. Each zone gets a marker at the right edge (open circle) so the active level is unmistakable.
- Delta volume label. Sum signed volume from broken pivot through breakout: +volume on close > open bars, −volume on close < open bars. The label renders above (bullish) or below (bearish) the triangle in the matching color.
- Invalidation lifecycle. A zone is deleted when the candle body (open and close together) crosses the level on the current or previous bar. Wick-only spikes are tolerated; only committed closes invalidate. Active zones are also capped at Amount — when the cap is exceeded, the oldest is dropped.
Pivot detection necessarily lags by Length bars (that’s how confirmed pivots work) — the breakout itself is detected on the closing bar, but the pivot it broke was confirmed Length bars earlier.
🛠️ Using It in a Strategy
Choch Pattern Levels is a visual indicator — it draws zones for you to read, but exposes no Series<> outputs. A strategy that wants to trade CHOCHs needs its own pivot detection. The example below uses NT8’s Swing primitive to track recent pivot highs and lows, then enters on the same break logic the indicator uses internally — keep the indicator on the chart for visual confirmation of the strategy’s signals.
Below is the lifecycle: instantiate Swing in State.DataLoaded, then in OnBarUpdate watch for the high / low to break the most recent confirmed pivot in the opposite direction.
private ChochPatternLevels choch;
private Swing swing;
private bool   trendUp;
private double lastPh, lastPl;

protected override void OnStateChange()
{
    if (State == State.SetDefaults)
    {
        Name = "ChochPatternLevelsStrategyExample";
    }
    else if (State == State.DataLoaded)
    {
        // Visual companion only — adds the triangle zones to the chart.
        choch = ChochPatternLevels(
            10,                                          // Length
            10,                                          // Amount of Patterns
            true,                                        // Show Delta Volume
            ChochPatternLevels_TextSize.Normal           // Delta Text Size
        );

        // Strategy-side pivot tracker — same Length window as the indicator.
        swing = Swing(10);
        trendUp = false;
        lastPh = lastPl = double.NaN;
    }
}

protected override void OnBarUpdate()
{
    if (CurrentBar < 30) return;

    double ph = swing.SwingHigh[0];
    double pl = swing.SwingLow[0];
    if (!double.IsNaN(ph)) lastPh = ph;
    if (!double.IsNaN(pl)) lastPl = pl;
    if (double.IsNaN(lastPh) || double.IsNaN(lastPl)) return;

    bool bullChoch = !trendUp && High[0] > lastPh;
    bool bearChoch =  trendUp && Low[0]  < lastPl;

    if (bullChoch)
    {
        trendUp = true;
        EnterLong();
        SetStopLoss(CalculationMode.Price, lastPl);
    }
    if (bearChoch)
    {
        trendUp = false;
        EnterShort();
        SetStopLoss(CalculationMode.Price, lastPh);
    }
}
Swing‘s last-confirmed-pivot lookup uses the same Length window as the indicator, so the strategy and the visual zones agree on what counts as a pivot.
Public Outputs
| Output | Type | Description |
|---|---|---|
| — | — | ChoCh Pattern Levels is a chart-decoration indicator without Series outputs. A strategy that wants to act on CHOCHs runs its own pivot detection — see the example below. |
🔄 Conversion Notes
A few things changed in the translation from Pine Script to NinjaScript:
Triangle fill via SharpDX PathGeometry. Pine’s polyline with three vertices and a translucent fill becomes a per-zone SharpDX PathGeometry built once and rendered each frame. The geometry is rebuilt only when the zone’s vertices change.
Vertex markers via FillEllipse. Pine’s label.style_circle at the three vertices becomes per-vertex SharpDX FillEllipse calls. The right-edge marker (the active-level indicator) is an open circle drawn with DrawEllipse.
Delta volume label via DirectWrite. The cumulative signed-volume label uses a SharpDX TextFormat sized by the DeltaTextSize enum, drawn above bullish triangles and below bearish ones.
Body-cross invalidation. Each bar, every active zone is checked: if the current or prior bar’s body straddles the level (open and close on opposite sides), the zone is marked for deletion. The check uses both bars so a single-bar wick that retraces doesn’t kill the zone, but a body that re-crosses on either bar does.
Active-zone cap with FIFO eviction. When a new CHOCH brings the active count above Amount, the oldest zone is dropped first. This keeps memory bounded and the chart legible.
Tag suffixes for stable identity. Each zone’s drawing tags include _phBar_curBar so SharpDX redraws don’t double-count or drop existing zones — important for live charts that re-render frequently.
📦 Download
The full source is available as a free NinjaScript Archive. To install:
- Download the
.zipfile below. - In NinjaTrader 8, go to Tools → Import → NinjaScript Add-On.
- Select the downloaded
.zipfile. - The indicator will appear under Indicators → indTradingView → Choch Pattern Levels [BigBeluga] on your chart.
📊 Chart Example
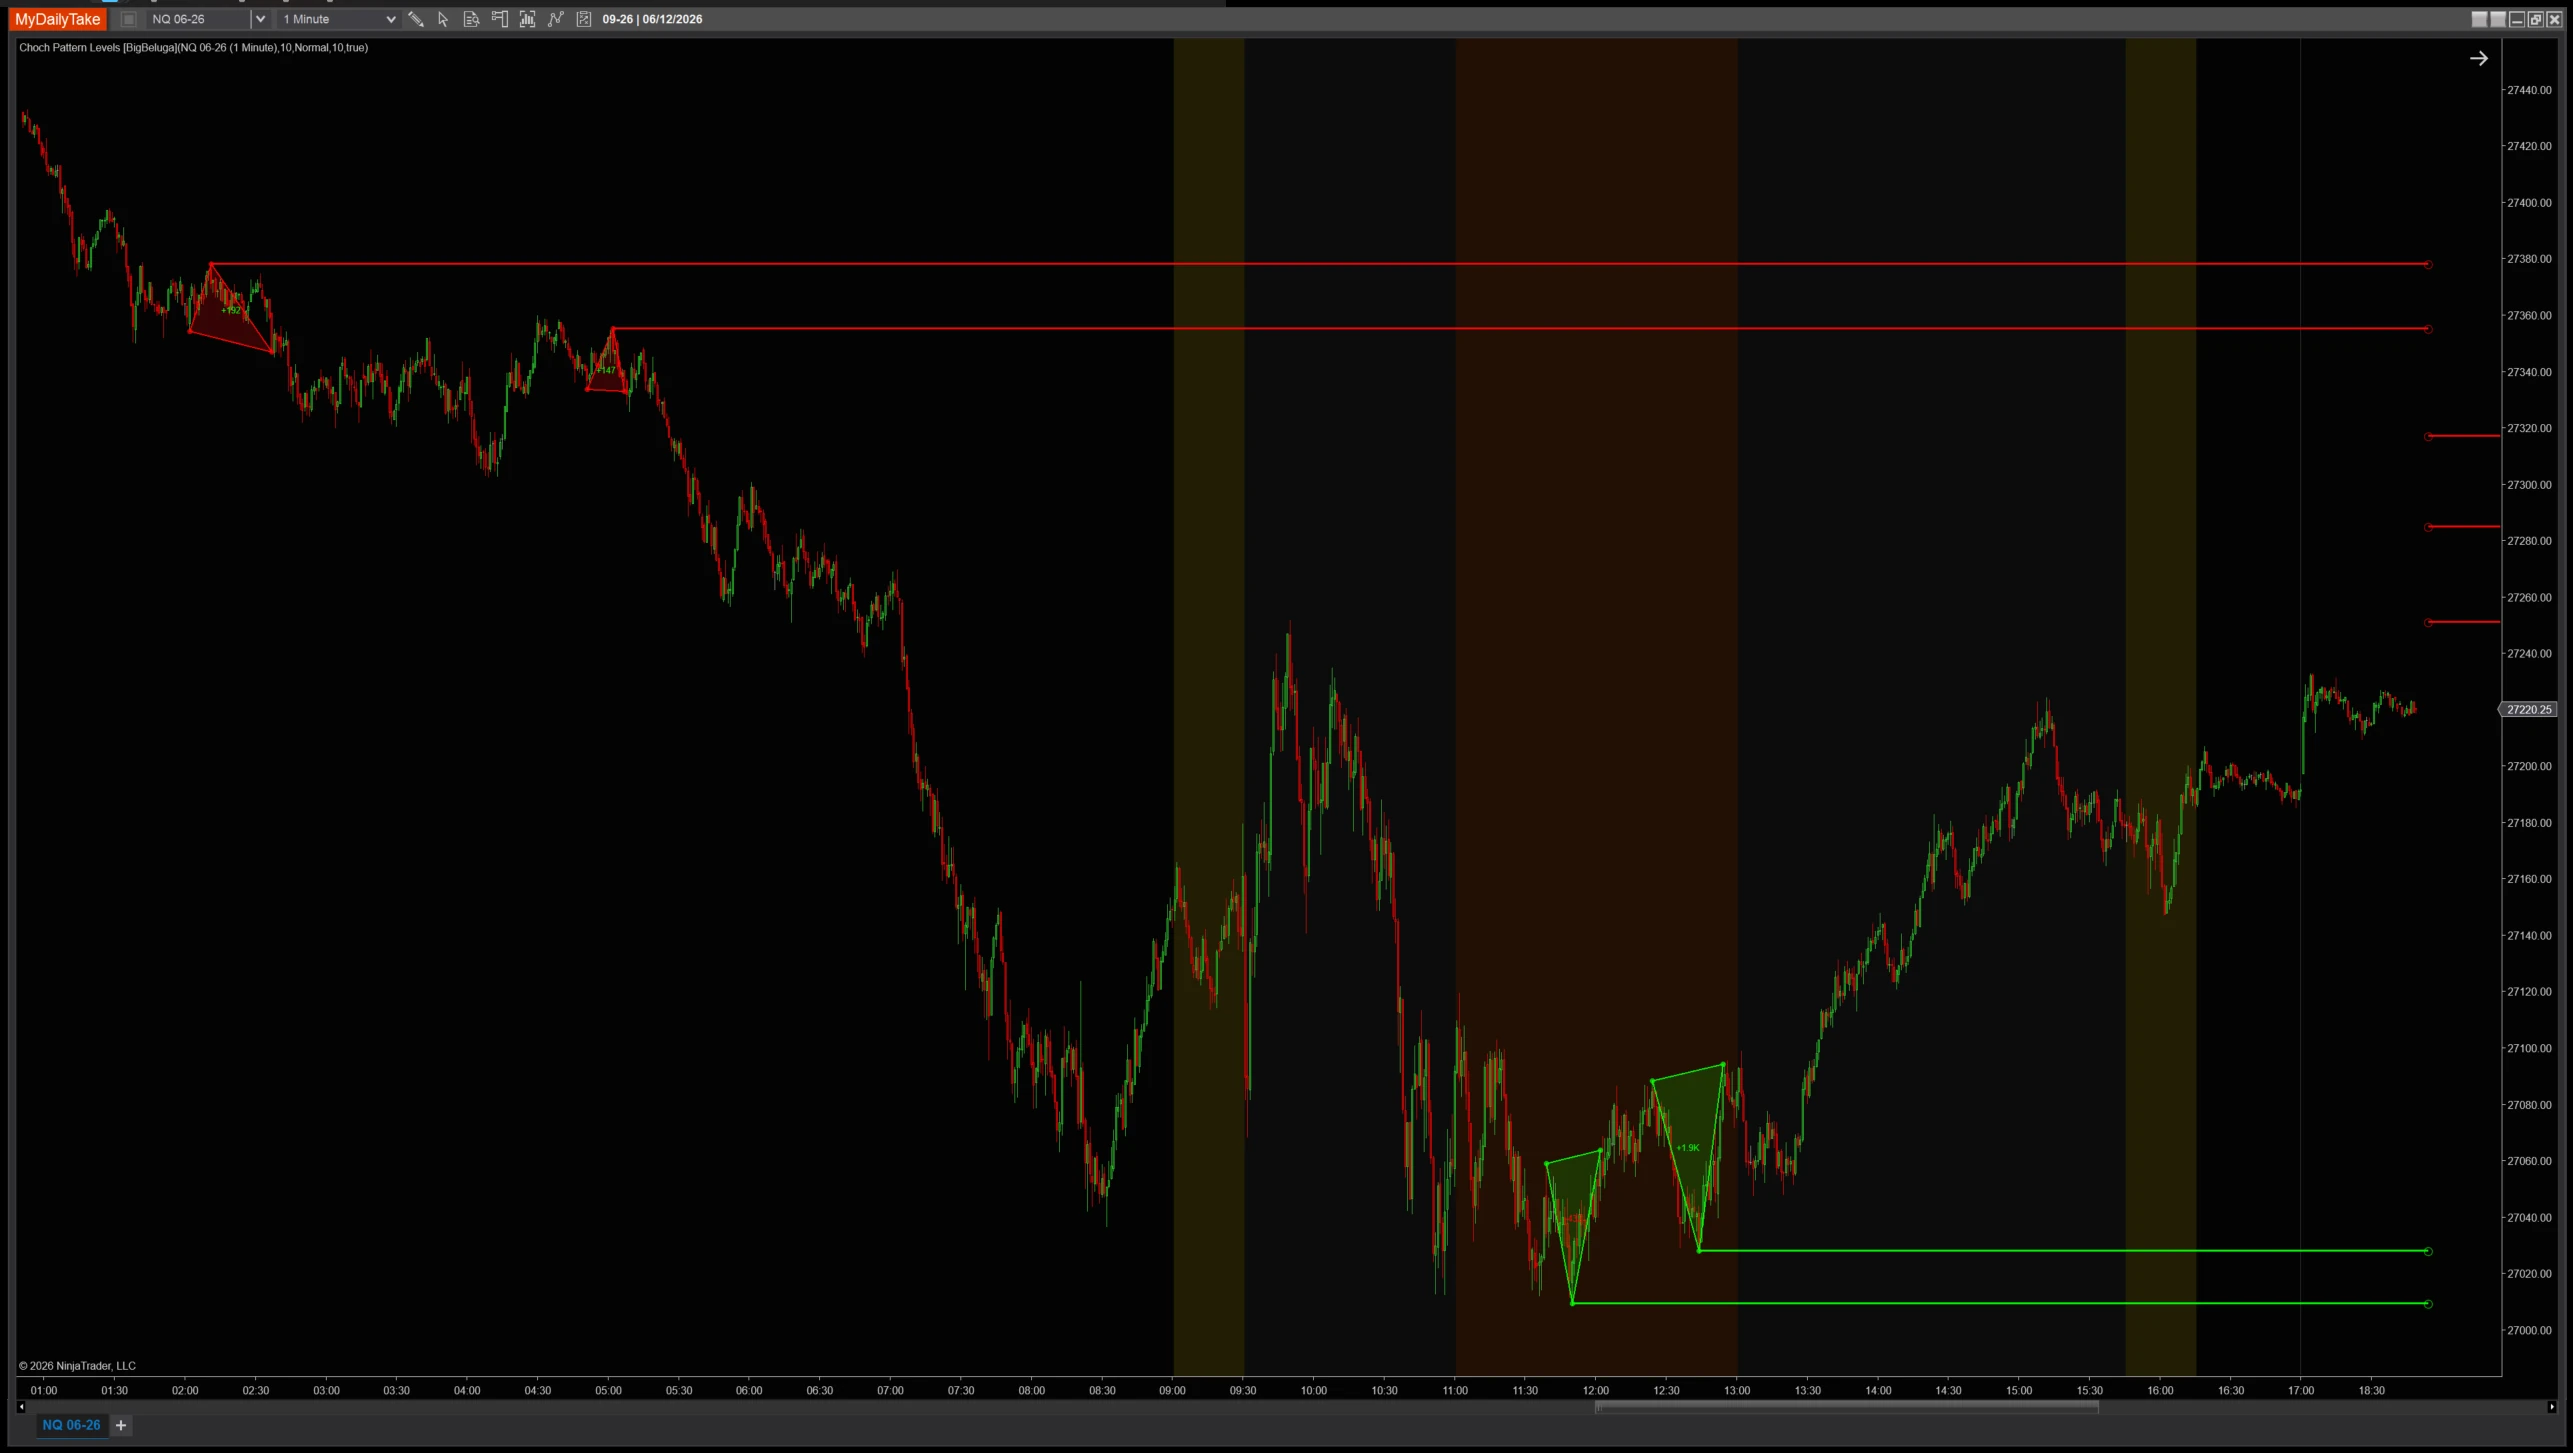
Choch Pattern Levels on a 1-minute chart with default settings (Length=10, Amount=10). Each CHOCH break draws a colored triangle from the broken pivot through the breakout bar to the most extreme price in between, with a horizontal level extending right. Delta volume labels show the participation behind each break. Levels invalidate when the candle body crosses, so active zones are always real, current structure.


The original Pine Script™ code is by BigBeluga and is licensed under the Attribution-NonCommercial-ShareAlike 4.0 International (CC BY-NC-SA 4.0). This NinjaTrader 8 adaptation is by MyDailyTake.com. The use of BigBeluga’s name or adapted code does not imply endorsement by the original author.
