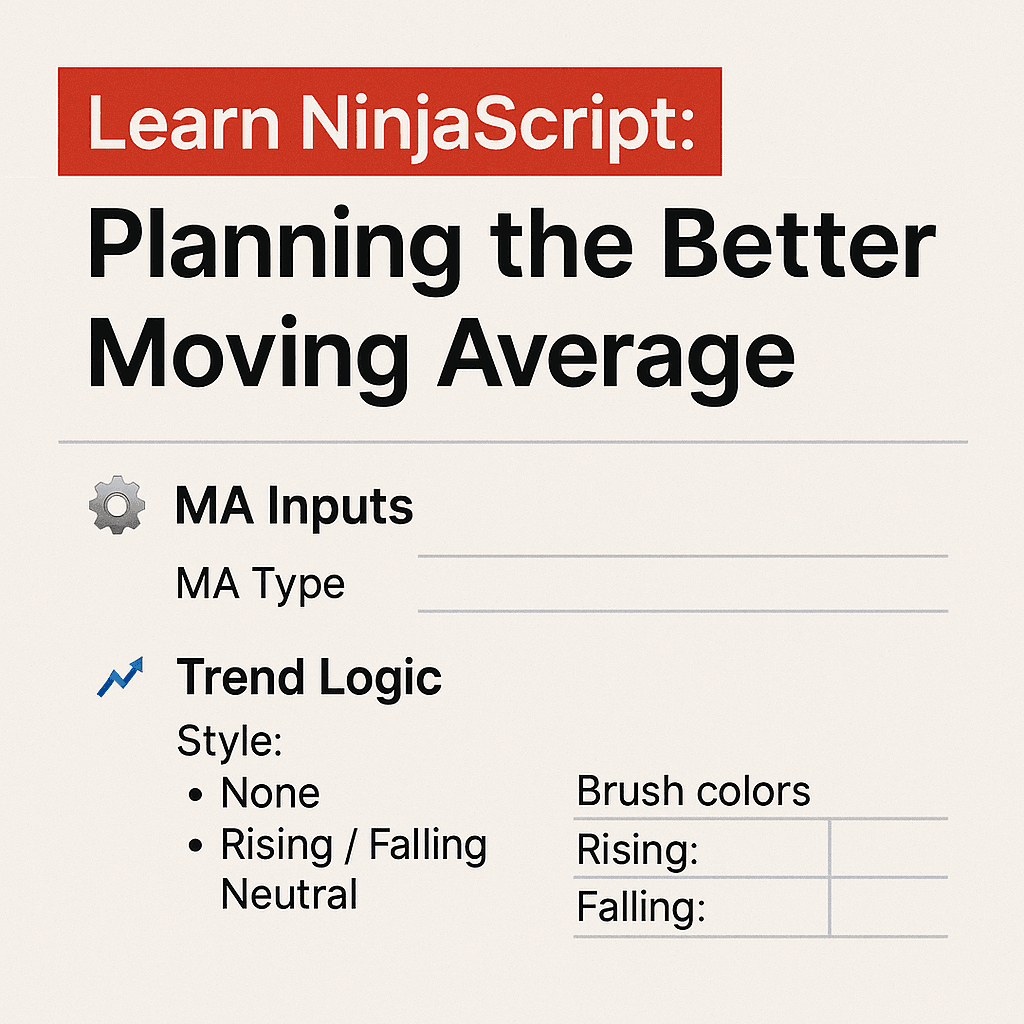
Learn NinjaScript: Planning the Better Moving Average (BMA Part 2)
In the last post, we kicked things off with the big idea: build a better moving average indicator—one that adapts to your logic, reflects it visually on the chart, and gives you full control over how it behaves.
But before we start writing code, we need a blueprint.
Rushing into NinjaScript without a plan is one of the fastest ways to create something messy, hard to maintain, or worse—totally unusable. That’s why this post is dedicated to laying out exactly what we want this indicator to do, what settings we’ll need to expose to the user, and how we’ll organize everything to keep the code clean and scalable.
And since we’re building this live, you’ll get to see that thought process in action. If we run into design limitations later, we’ll talk about how to fix them. That’s part of what this series is all about: not just the finished product, but the real steps it takes to build something useful from scratch.
Let’s break it down and design this thing the right way.
🔍 Why Planning Matters
It’s easy to think, “I’ll just start coding and figure it out as I go.” And sure—you can do that. But if you don’t define the structure up front, you’ll constantly find yourself hacking things together, rewriting logic, or trying to force visuals into code that wasn’t built to support them.
This is especially true for indicators that are meant to be flexible and customizable—like the one we’re building.
We want this script to:
- Support multiple logic styles (not just one hardcoded condition)
- Let users choose how trend is defined and how it’s displayed
- Be cleanly organized so that visuals (plot, bars, background) are decoupled from logic
- Be easy to extend later if we want to add alerts, smoothing, confirmation filters, or additional behavior
That’s what we’re planning today. By defining the inputs, logic options, and visual structure before we write a single if statement, we’ll save ourselves time and make this indicator something that’s actually worth keeping in your toolkit.
Let’s start with the moving average core inputs.
📘 Moving Average Inputs
At the heart of this indicator is a moving average. But instead of locking the user into one type (like an SMA or EMA), we want to let them choose which built-in NinjaTrader moving average they want to use—and how it behaves.
That means we need two core inputs:
| Property | Type | Purpose |
|---|---|---|
| MAType | enum | Let the user select from built-in options like SMA, EMA, HMA, WMA, etc. |
| Period | int | Defines the lookback period (e.g., 14, 50, 100, etc.) |
But there’s a catch: not all moving averages support all periods.
For example, using a period of 1 for HMA might break or return strange results. So we’ll either:
- Add validation inside the code when the user selects a period, or
- Limit period options dynamically based on the MA type (if you really want to go advanced later)
In our code, we’ll likely use a switch statement to map the user’s selection to the correct built-in NinjaTrader indicator. We’ll also need to store a reference to the selected MA’s values so we can analyze them for trend logic later.
This is the foundation everything else will build on—so keeping it flexible and stable matters.
Next, let’s figure out how we’ll define trend.
🧠 Trend Logic Style
Now that we know what kind of moving average the user can select, we need to define how we’ll interpret the trend based on that line.
We don’t want to hard-code just one method—every trader thinks about trend differently. Some look for slope, others care about crossovers, and some just want to know if the price is above or below the line.
So instead of forcing a single logic style, we’ll give users control through a dropdown-style enum called TrendStyle. This will let them choose from several common ways to define trend:
🧭 TrendStyle options:
| Option | Description |
|---|---|
| None | Disables trend logic completely. Nothing will be calculated or visualized. |
| RisingFallingNeutral | Compares current MA value (MA[0]) to the previous value (MA[1]) to detect slope. |
| RisingFallingLast | The same as RisingFallingNeutral but we use the last trend value when the trend is "neutral." |
| CloseAboveBelow | Checks whether the price's close is above or below the MA. Classic filter logic. |
| LowAboveHighBelow | Determines trend based on whether the low is above or high is below the MA—often used in confirmation filters. |
This one input will completely change the logic we use later on in OnBarUpdate(). So our plan is to structure the code using a switch block to route the behavior based on this setting. Each logic condition will feed into its own internal signal (likely a Series<int>) that other parts of the script (like visuals or alerts) can tap into.
By isolating this logic, we keep our visuals fully decoupled—no messy if statements cluttering up our brush assignments.
Next, let’s look at how we’ll handle visuals while a trend is active.
🎨 Visuals — Trend State
Once we’ve detected a trend, we need to decide what the chart should actually do with that information. This is where visuals come in—and where we give the user full control over how trend conditions are displayed.
This section covers the visual feedback that happens while a trend is ongoing (not when it changes). Think of it as: “the market is trending right now—how do I want to see that?”
Here’s what we’re going to support:
🟥 Color Bars
| Input | Purpose |
|---|---|
| EnableTrendBarColor (bool) | Toggle on/off bar coloring during a trend |
| TrendBarBrushUp | Brush color for rising trends |
| TrendBarBrushDown | Brush color for falling trends |
| TrendBarBrushNeutral | Optional, for flat/neutral detection |
| TrendBarAlpha | Transparency control (either 0–1 or 0–255) |
We’ll use BarBrushes[] to apply color to price bars in OnBarUpdate() when the corresponding trend condition is true.
🖼️ Color Background
| Input | Purpose |
|---|---|
| EnableTrendBackground (bool) | Toggle on/off background shading |
| TrendBackBrushUp / Down / Neutral | Same structure as bar brushes |
| TrendBackAlpha | Controls opacity of the shading |
We’ll use BackBrushes[] here for chart-wide visual context. Some traders love this for context; others will turn it off.
All of these will be controlled independently. If the user just wants background shading and bar color? Totally fine. We’ll make sure they have that option later in the logic.-
Next, we’ll focus on what happens when the trend flips.
🔄 Visuals — Trend Change
Unlike the visuals we apply during a trend, this section is all about the moment when direction flips—from rising to falling, falling to rising, or into a neutral zone if that’s supported.
These events are often more actionable, and they tend to be where traders want a little extra attention—color flashes, arrows, or even audio alerts.
Here’s what we’ll support when a trend changes:
🟥 Color Bars and Background on Flip
We’ll allow different visuals to be triggered just once when a new direction is detected. The idea is to emphasize the change, not maintain the visual throughout the entire trend. We will use similar inputs as above.
➡️ Draw Arrow on Change
| Input | Purpose |
|---|---|
| EnableChangeArrow | Turns the arrow on or off |
| ChangeArrowColorUpToDown / DownToUp | Sets arrow color per direction |
| ArrowSize | Optional input for arrow scaling |
| ArrowOffsetY | Optional vertical positioning of the arrow |
This gives the user a consistent, clean visual that marks the exact bar where the transition occurred.
🔔 Alert on Trend Flip
| Input | Purpose |
|---|---|
| EnableChangeAlert | Enables sound and/or message alerts |
| ChangeAlertSound | Dropdown of available sound files in NT8 |
| ChangeAlertMessage | Custom message that can appear in log/output |
Alerts will only fire once per change, and we’ll build in tracking to prevent duplicate firings on the same direction.
🧱 Structuring the UI with Display Groups
We’ve planned a lot of inputs—and if we just dump them into the NinjaTrader settings panel, it’ll be overwhelming. To keep things clean and user-friendly, we’ll organize everything using [Display(GroupName = "...")].
Each major section will have its own group so that related options stay visually bundled together.
Here’s how we’ll group them:
| Group Name | What It Contains |
|---|---|
| 01. Moving Average Settings | MA type, period, and any validation logic |
| 02. Trend Logic | TrendStyle enum and any thresholds or detection logic |
| 03. Visuals – Trend State | Brushes and alpha for ongoing trend conditions |
| 04. Visuals – Trend Change | Flip visuals: arrows, flip-specific brushes, and alerts |
This structure keeps the user experience smooth and helps us manage the code more easily as we add new features. Each group will be implemented in order, and we’ll use consistent [Order = X] attributes within each section to keep everything intuitive.
📋 Planning Recap
Before we jump into building the indicator, here’s a quick recap of everything we just defined:
| Section | What We’re Doing |
|---|---|
| MA Settings | Let the user select which moving average to use and define the lookback period |
| Trend Logic | Allow the user to choose how a trend is detected (slope, price cross, etc.) |
| Visuals – Trend | Show color changes on the chart while a trend is active (bars, background) |
| Visuals – Change | Trigger one-time visuals and alerts when the trend direction flips |
| Display Grouping | Keep inputs organized with clear group names and consistent order |
This plan gives us a solid foundation that’s flexible, easy to debug, and simple to expand. Every input, logic block, and visual option has a purpose—and we’ll start wiring them up in the next post.
🎉 Prop Trading Discounts
💥89% off at Bulenox.com with the code MDT89