
Learn NinjaScript: Creating Custom Drawing Tools (Advanced)
An orientation to building custom drawing tools in NinjaScript. DrawingTool class, anchor system, mouse handlers, and rendering — the minimum viable shape of a user-placed chart tool.
NinjaScript tutorials from someone who’s been writing it since NT6.5. Start at the top if you’re new — or jump to whatever you’re stuck on.
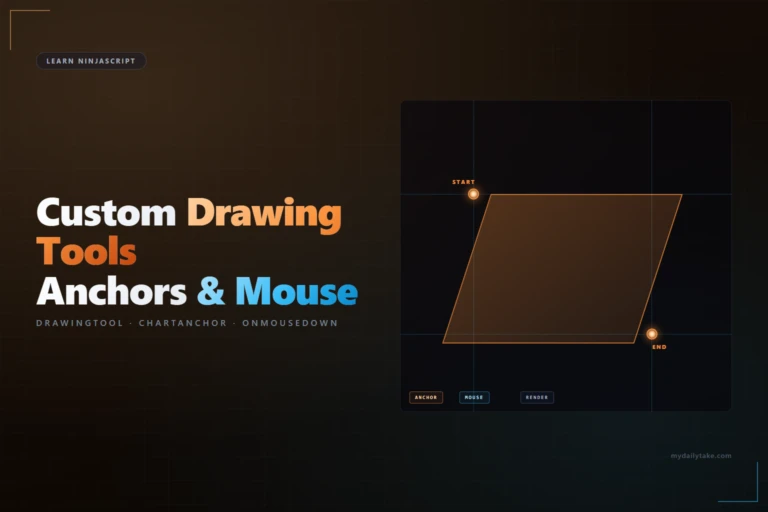
An orientation to building custom drawing tools in NinjaScript. DrawingTool class, anchor system, mouse handlers, and rendering — the minimum viable shape of a user-placed chart tool.
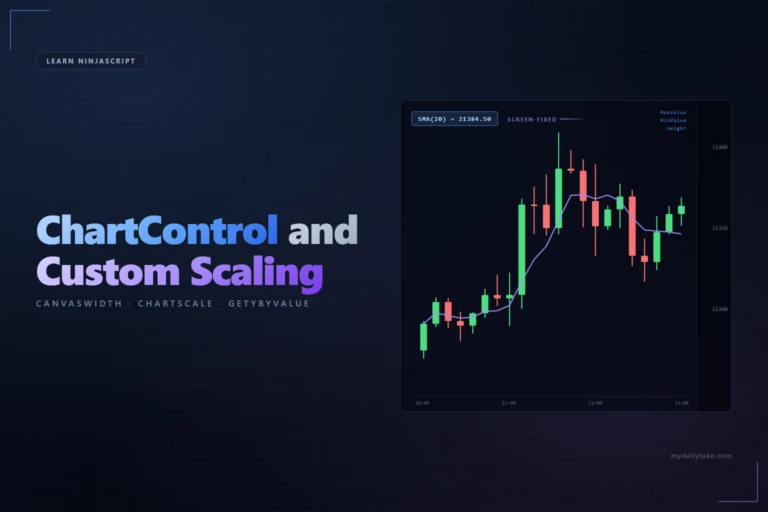
How to read ChartControl and ChartScale in NinjaScript for custom overlays. Canvas dimensions, visible bar range, pixel-to-value conversion, and patterns for zoom-responsive rendering.
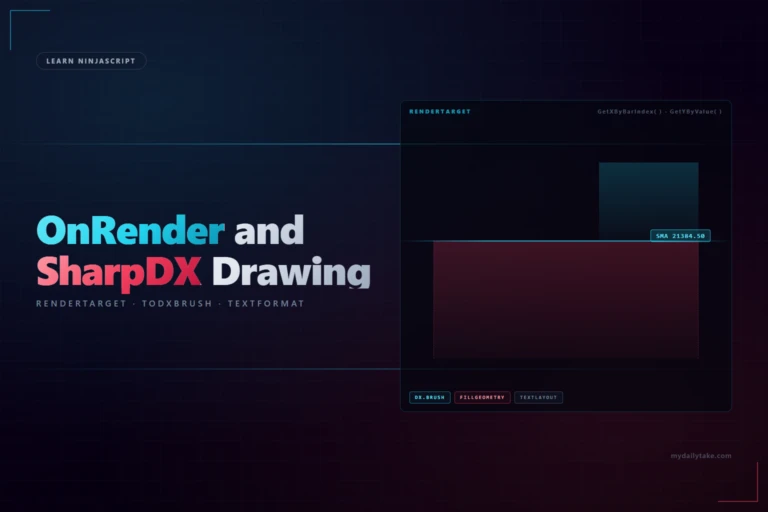
When to leave Draw.* behind and take over the chart canvas with OnRender and SharpDX — render gating, RenderTarget lifecycle, coordinate conversion, and a SMA value-label anchor.
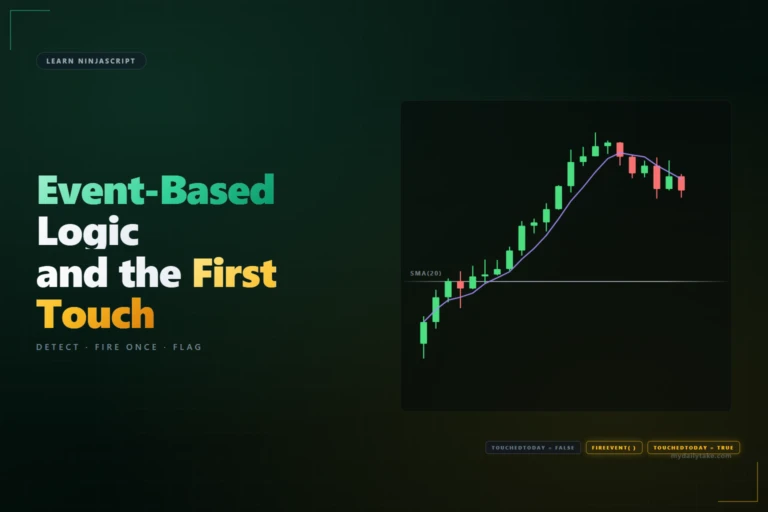
How to detect events in NinjaScript — price touches, session transitions, and threshold crosses — using fired-this-bar flags and once-per-session flags for single-fire logic.
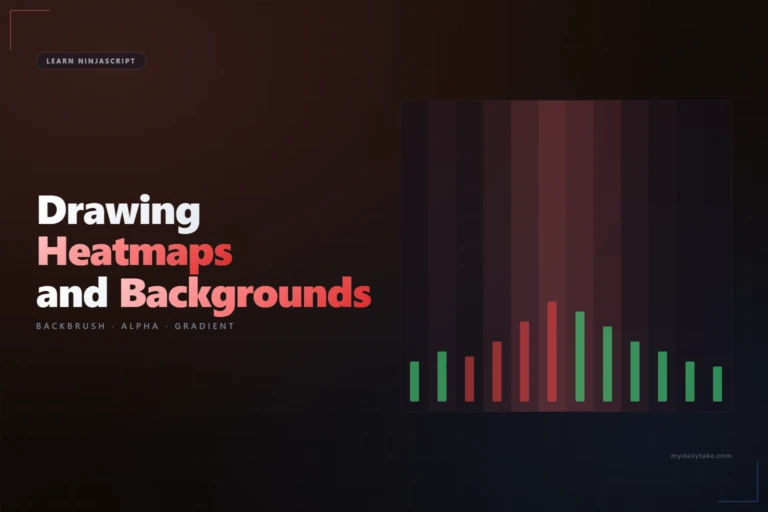
A line says “trend is up.” A background gradient that deepens in color as trend strengthens says “trend is up, and getting stronger for three bars now.” Backgrounds are an underused signal channel — cheap to implement, expressive when done well, and invisible until the reader hovers to notice them. BackBrush paints the current bar’s…
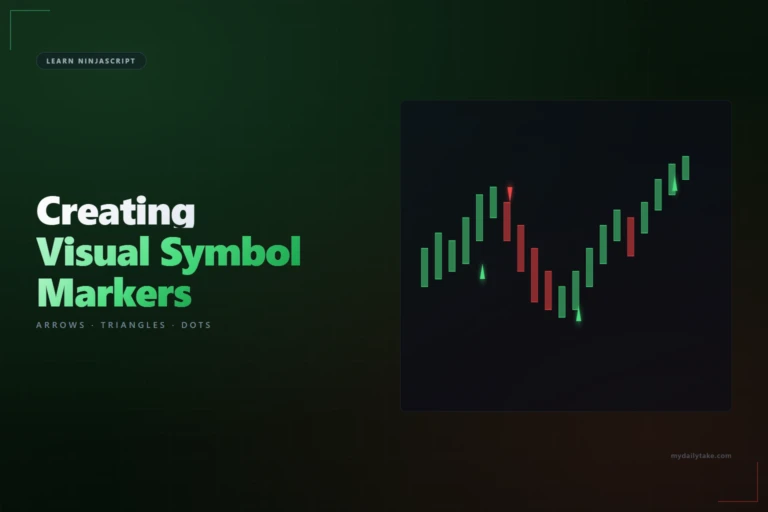
Signals need to be visible on the chart. Arrows for entries, triangles for reversals, dots for bar-by-bar markers, diamonds for key levels. NinjaScript’s Draw.* family ships a handful of stock marker types that cover most needs — the mechanics are simple, the UX details are what separate a polished indicator from a sloppy one. This…
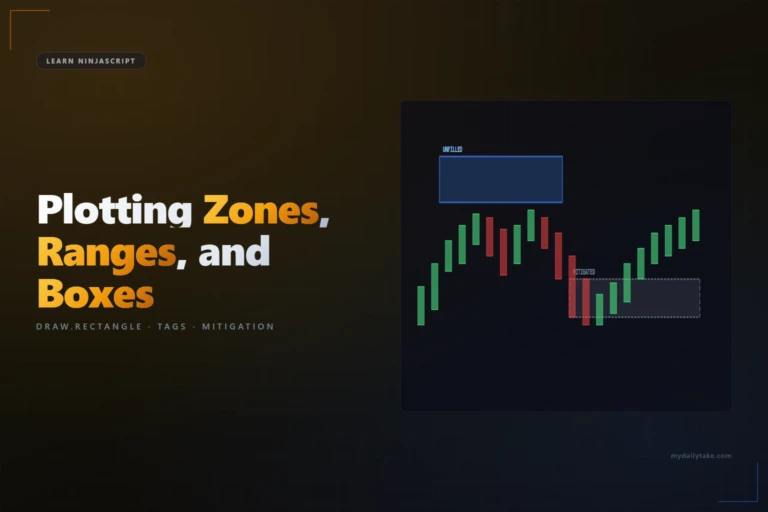
Zones and ranges carry more information than lines. A Fair Value Gap is a box that tells you where price left unfilled orders. An Opening Range is a box bounded by the first session hour’s high and low. A Supply/Demand zone is a rectangle with a story — price rejected from this area, and traders…
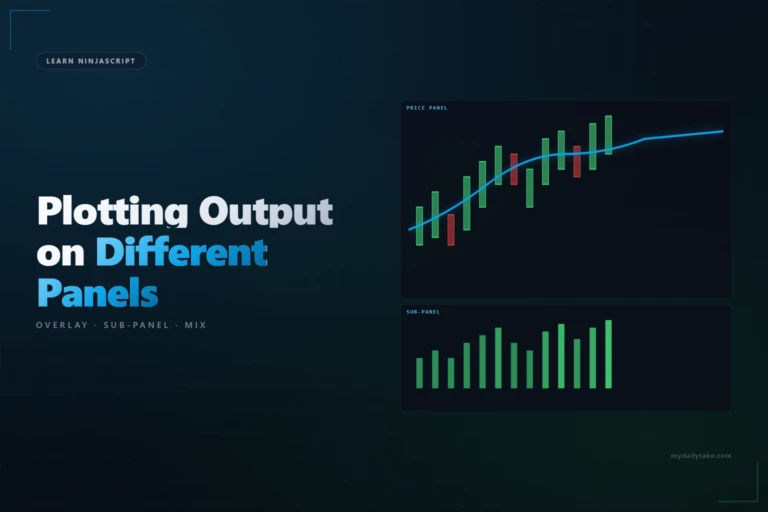
Some indicators belong on the price panel — moving averages, VWAP, pivots, trend lines. Some belong in a sub-panel — RSI, MACD, oscillators, anything whose scale is unrelated to price. A few indicators want both: an overlay line on the price panel plus a histogram or secondary metric in a sub-panel below. NinjaScript’s IsOverlay property…
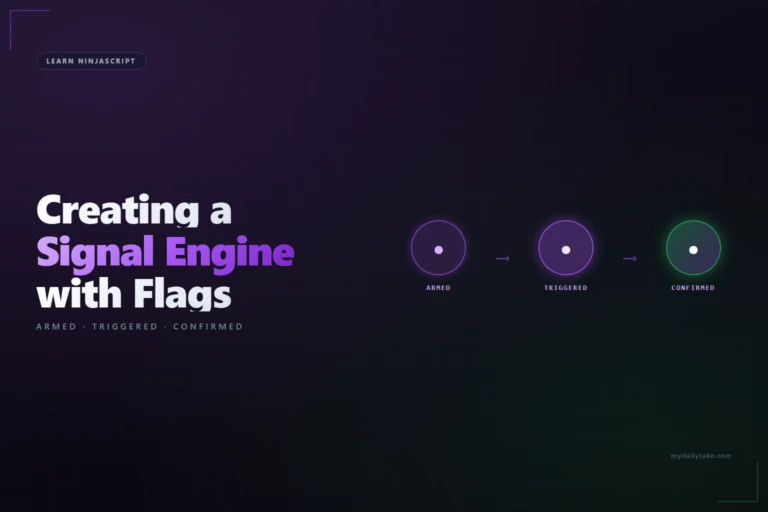
A single-bar signal is easy. “Close above SMA” or “RSI crossed 30” fits in one if block. Multi-bar signals — “setup bar, then a confirmation bar within three bars, then a trigger bar” — turn into nested conditions that are fragile, hard to test, and almost impossible to debug when they misfire. A state machine…
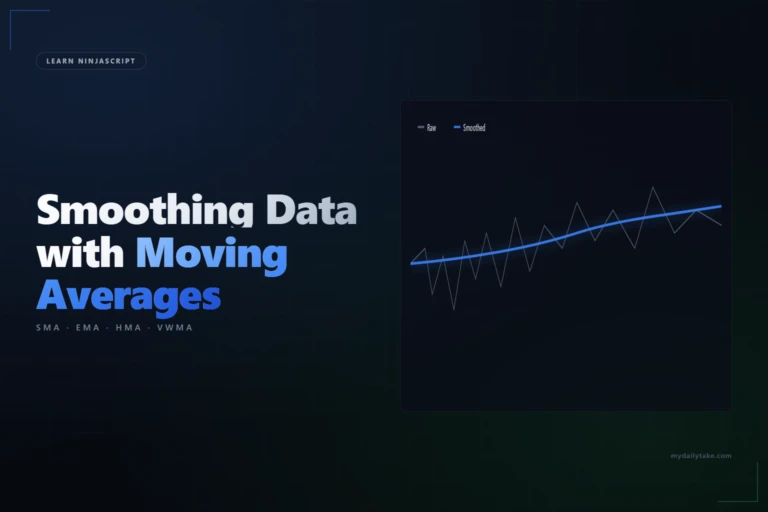
“I have a jittery calculation and I want to smooth it.” The answer is almost always “call one of NinjaTrader’s built-in moving-average indicators on your existing Series.” NinjaScript ships SMA, EMA, WMA, HMA, TEMA, DEMA, VWMA, and several others as indicator objects you instantiate and call the same way you’d call SMA on Close. This…
The Account Copier mirrors one leader account to every follower in lockstep, on the same machine, across your LAN, or through the cloud relay. Free on one account.
Notifications
