TradingView SuperTrend+ [Electrified] Conversion to NinjaTrader 8
The SuperTrend indicator is one of the most widely used trend-following tools in all of trading. It draws a single line on your chart — green below price in an uptrend, red above price in a downtrend — and flips when price crosses the trailing stop level. Simple, visual, and effective.
But the version most traders use is the basic one. Electrified’s SuperTrend+ on TradingView takes the concept further with features that matter in real trading: confirmation bars to filter false reversals, multiple ATR smoothing modes including a volume-adjusted weighted average, and an outlier filter that prevents a single wild bar from blowing up the ATR calculation.
This post walks through the NinjaTrader 8 conversion, explains what each feature does, and provides the full source code for free download.
Original Pine Script: SuperTrend+ by Electrified
Dependent library: SupportResistanceAndTrend by Electrified
License: Mozilla Public License 2.0 (MPL 2.0)
🆚 What Makes SuperTrend+ Different from Standard SuperTrend
If you’ve used the “standard” SuperTrend in NinjaTrader or the standard KivancOzbilgic version on TradingView, you know the basic idea: ATR multiplied by a factor creates upper and lower bands, and the trend flips when price crosses the active band.
SuperTrend+ adds three things that address the most common complaints traders have with the standard version:
Confirmation bars. Instead of flipping the trend the instant price crosses the band, SuperTrend+ can require a configurable number of closed bars beyond the band before confirming the reversal. This filters out the quick wicks and false breaks that cause whipsaw in choppy markets. The default is 2 bars of confirmation, and the line changes to a yellow “unconfirmed” color while waiting — so you can see when a potential reversal is being tested but not yet confirmed.
Multiple ATR modes. The standard SuperTrend uses a simple RMA (or SMA) to smooth the True Range into an ATR value. SuperTrend+ offers five options: SMA, EMA, WMA, VWMA, and VAWMA (Volume-Adjusted Weighted Moving Average). The VAWMA mode — the default — weights recent bars more heavily and factors in volume, which makes the ATR more responsive to high-volume moves and less reactive to low-volume noise.
Outlier filtering. A single large-range bar (news spike, flash crash, fat finger) can distort the ATR for the entire lookback period. SuperTrend+ includes a Max Deviation parameter that identifies True Range values beyond a configurable number of standard deviations from the rolling mean, then replaces them with the mean value. This keeps the ATR stable through outlier events without manual intervention.
⚙️ Settings
SuperTrend+ exposes its parameters in three groups inside the NinjaTrader indicator panel: Average True Range (ATR smoothing and multiplier), Confirmation (how many bars must close past the band before a reversal is committed), and Display (line colors, fill opacity, Buy/Sell labels). Each group and its defaults are listed below.
Average True Range
| Parameter | Default | Description |
|---|---|---|
| Mode | VAWMA | Averaging function used to smooth the True Range. Options: SMA, EMA, WMA, VWMA, VAWMA. |
| Period | 120 | Number of bars used when computing ATR. Higher values produce a smoother, slower-reacting SuperTrend line. |
| Multiplier | 3.0 | Multiplied against the ATR to set the distance of the SuperTrend bands from price. Higher values mean wider bands and fewer reversals. |
| Max Deviation | 0.0 | Standard deviation limit for filtering outlier True Range values. Set to 0 to disable. A value of 3.0 filters bars with TR more than 3 standard deviations from the rolling mean. |
Confirmation
| Parameter | Default | Description |
|---|---|---|
| Closed Bars | 2 | Number of consecutive closed bars that must exceed the SuperTrend band before a reversal is confirmed. Set to 0 for instant reversals (standard SuperTrend behavior). |
Display
| Parameter | Default | Description |
|---|---|---|
| Show Buy / Sell Labels | Off | Draws text labels at trend reversal points in addition to the dot marker. |
| Highlighter On | On | Fills the area between the OHLC4 midline and the active trend line with a translucent color. |
| Highlighter Opacity | 25% | Opacity of the fill between the trend line and OHLC4. |
| Label Text Size | 12 | Font size of the Buy/Sell labels when enabled. |
| Up Trend Color | LimeGreen | Color of the uptrend line, dot markers, and bullish fill. |
| Down Trend Color | Red | Color of the downtrend line, dot markers, and bearish fill. |
| Unconfirmed Color | Yellow | Color of the trend line while a reversal is being tested but not yet confirmed. |
| Buy / Sell Label Colors | LimeGreen / Red | Text color of the Buy and Sell labels when enabled. |
🧠 How It Works
The core logic runs in OnBarUpdate and follows this sequence every bar:
- True Range calculation. Standard True Range — the greatest of (High – Low), |High – Previous Close|, or |Low – Previous Close|.
- Outlier filter. If Max Deviation is set above 0, the indicator computes the rolling mean and standard deviation of TR over the ATR period. Any TR value beyond the deviation limit gets replaced with the rolling mean. This prevents a single wild bar from inflating the ATR.
- ATR smoothing. The cleaned True Range series is passed through the selected moving average mode (SMA, EMA, WMA, VWMA, or VAWMA) to produce the final ATR value.
- Band calculation. The upper band is
Low - (Multiplier × ATR)and the lower band isHigh + (Multiplier × ATR). These are the raw trailing stop levels. Each band can only move in its favorable direction — the upper band ratchets up, the lower band ratchets down — as long as the current trend holds. - Trend state machine. This is where SuperTrend+ diverges from the standard version:
- Gap case: If price gaps entirely past the opposite band (Low > last lower band, or High < last upper band), the trend flips instantly regardless of the confirmation setting. Gaps represent strong directional moves that shouldn’t wait for confirmation.
- Confirmed case: If price crosses the opposite band but doesn’t gap past it, the indicator starts counting closed bars beyond the band. Once the count reaches the Closed Bars setting, the reversal is confirmed.
- Unconfirmed state: While waiting for confirmation, the trend line changes to the Unconfirmed Color (yellow by default). This visual cue tells you a potential reversal is in progress without committing to it.
- Plot output. Only one plot is active at a time — UpTrend when the trend is bullish, DnTrend when bearish. The line color reflects whether the trend is confirmed or still pending. On confirmed reversals, a dot marker appears at the new trend line level, and optional Buy/Sell text labels are rendered via SharpDX.
🛠️ Using It in a Strategy
SuperTrend+ is designed to be read from a NinjaScript strategy, not just displayed on a chart. Every signal, trend state, and band level is exposed as a public Series<T> output — so strategies can read the current bar and look back through history (BuySignal[3] = was there a buy signal three bars ago?). Each getter wraps a call to Update() internally, which means reads from outside the indicator always sync to the latest bar before returning a value.
Below is the full lifecycle: instantiate the indicator in State.DataLoaded, then read signals and active levels inside OnBarUpdate. The public outputs are listed in a reference table after the code block.
// Add the indicator in State.DataLoaded
private SuperTrendPlus superTrend;

protected override void OnStateChange()
{
    if (State == State.DataLoaded)
    {
        superTrend = SuperTrendPlus(
            SuperTrendPlus_MaMode.VAWMA, // Mode
            120,                         // ATR Period
            3.0,                         // Multiplier
            0.0,                         // Max Deviation
            2,                           // Closed Bars
            false,                       // Show Signals
            true,                        // Highlighting
            25,                          // Highlight Opacity
            12                           // Text Size
        );
    }
}

protected override void OnBarUpdate()
{
    // All signal properties are Series<bool> — use [0] to read
    // the current bar's value. The Update() wrapper inside the
    // getter ensures the indicator is current before you read.

    // Check for trend reversals
    if (superTrend.BuySignal[0])
    {
        // Trend just flipped bullish
        EnterLong();
    }
    if (superTrend.SellSignal[0])
    {
        // Trend just flipped bearish
        EnterShort();
    }

    // Read the trend state directly
    // +1 = uptrend, -1 = downtrend, 0 = undefined
    int trend = superTrend.TrendSeries[0];

    // Access the active trend levels
    double support = superTrend.ActiveUpper[0];    // support level in uptrend
    double resistance = superTrend.ActiveLower[0]; // resistance level in downtrend

    // Warning[0] fires on the first bar that crosses the opposite band
    // (before confirmation completes)
    if (superTrend.Warning[0])
    {
        // Potential reversal starting — tighten stops or reduce size
    }

    // You can also look back: superTrend.BuySignal[1] checks the
    // previous bar, superTrend.TrendSeries[5] checks 5 bars ago, etc.
}All public outputs are Series types, which means you can index into them with [0] for the current bar, [1] for one bar ago, and so on. Each getter calls Update() internally, so the indicator is always current when you read it — no need to call Update() yourself.
Public Outputs
| Output | Type | Description |
|---|---|---|
| BuySignal[0] |
Series | True on the bar where the trend flips from bearish to bullish. |
| SellSignal[0] |
Series | True on the bar where the trend flips from bullish to bearish. |
| Warning[0] |
Series | True on the first bar that crosses the opposite band, before confirmation. |
| Reversal[0] |
Series | True on any bar where the trend state changes. |
| TrendSeries[0] |
Series | Current trend: +1 (up), -1 (down), 0 (undefined). |
| ActiveUpper[0] |
Series | Current upper (support) level. |
| ActiveLower[0] |
Series | Current lower (resistance) level. |
| UpTrend / DnTrend |
Series | Plot values u2014 only one is valid at a time depending on trend direction. |
🔄 Conversion Notes
A few things changed in the translation from Pine Script to NinjaScript:
Outlier substitution. Pine’s implementation substitutes outlier TR values with na, which causes the moving average to effectively skip those bars. NinjaScript doesn’t have the same na propagation behavior, so the NT8 version substitutes outlier values with the rolling mean instead. The visible behavior is equivalent on non-outlier bars. On outlier bars, the ATR dampens toward the mean rather than holding at the prior value — a minor numerical difference documented in the source code for transparency.
VAWMA implementation. The Volume-Adjusted Weighted Moving Average from Electrified’s MovingAverages library is computed inline in OnBarUpdate rather than as a separate indicator. It combines linear recency weighting (most recent bar gets the highest weight) with volume weighting.
Rendering. Pine Script’s fill() between the OHLC4 midline and the trend line is replicated using SharpDX path geometry in OnRender. The fill is drawn as a trapezoid between each pair of adjacent bars for pixel-accurate rendering at any zoom level. Buy/Sell labels are also rendered via SharpDX with configurable font size and color, rather than using Draw.Text objects.
Series-based public outputs. All signal properties (BuySignal, SellSignal, Warning, Reversal) are exposed as Series<bool> rather than plain bool fields. This means you can look back in history (BuySignal[3] = was there a buy signal 3 bars ago?) and it means external strategies get thread-safe reads via the Update() wrapper in each getter. TrendSeries, ActiveUpper, and ActiveLower follow the same pattern with private backing stores.
Alerts omitted. The original Pine script includes alert conditions. These are intentionally left out of the NT8 version — if you need programmatic signals, use the public BuySignal, SellSignal, Warning, and Reversal series from a strategy or add-on.
📦 Download
The full source code is available as a free download below. To install:
- Download the
.zipfile below. - In NinjaTrader 8, go to Tools → Import → NinjaScript Add-On.
- Select the downloaded
.zipfile. - The indicator will appear under Indicators → indTradingView → SuperTrend+ [Electrified] on your chart.
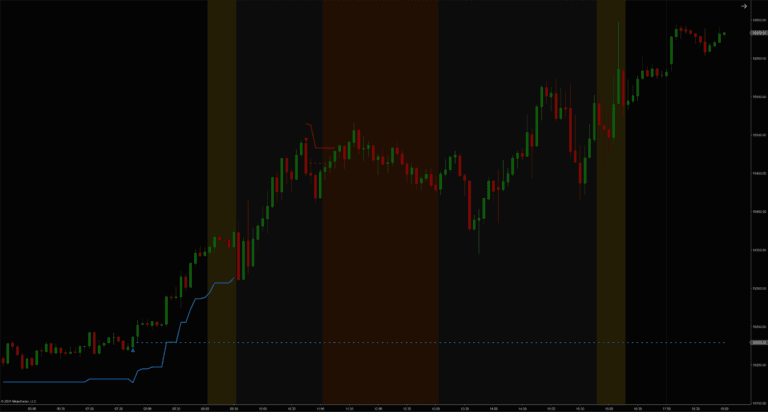
📊 Chart Example
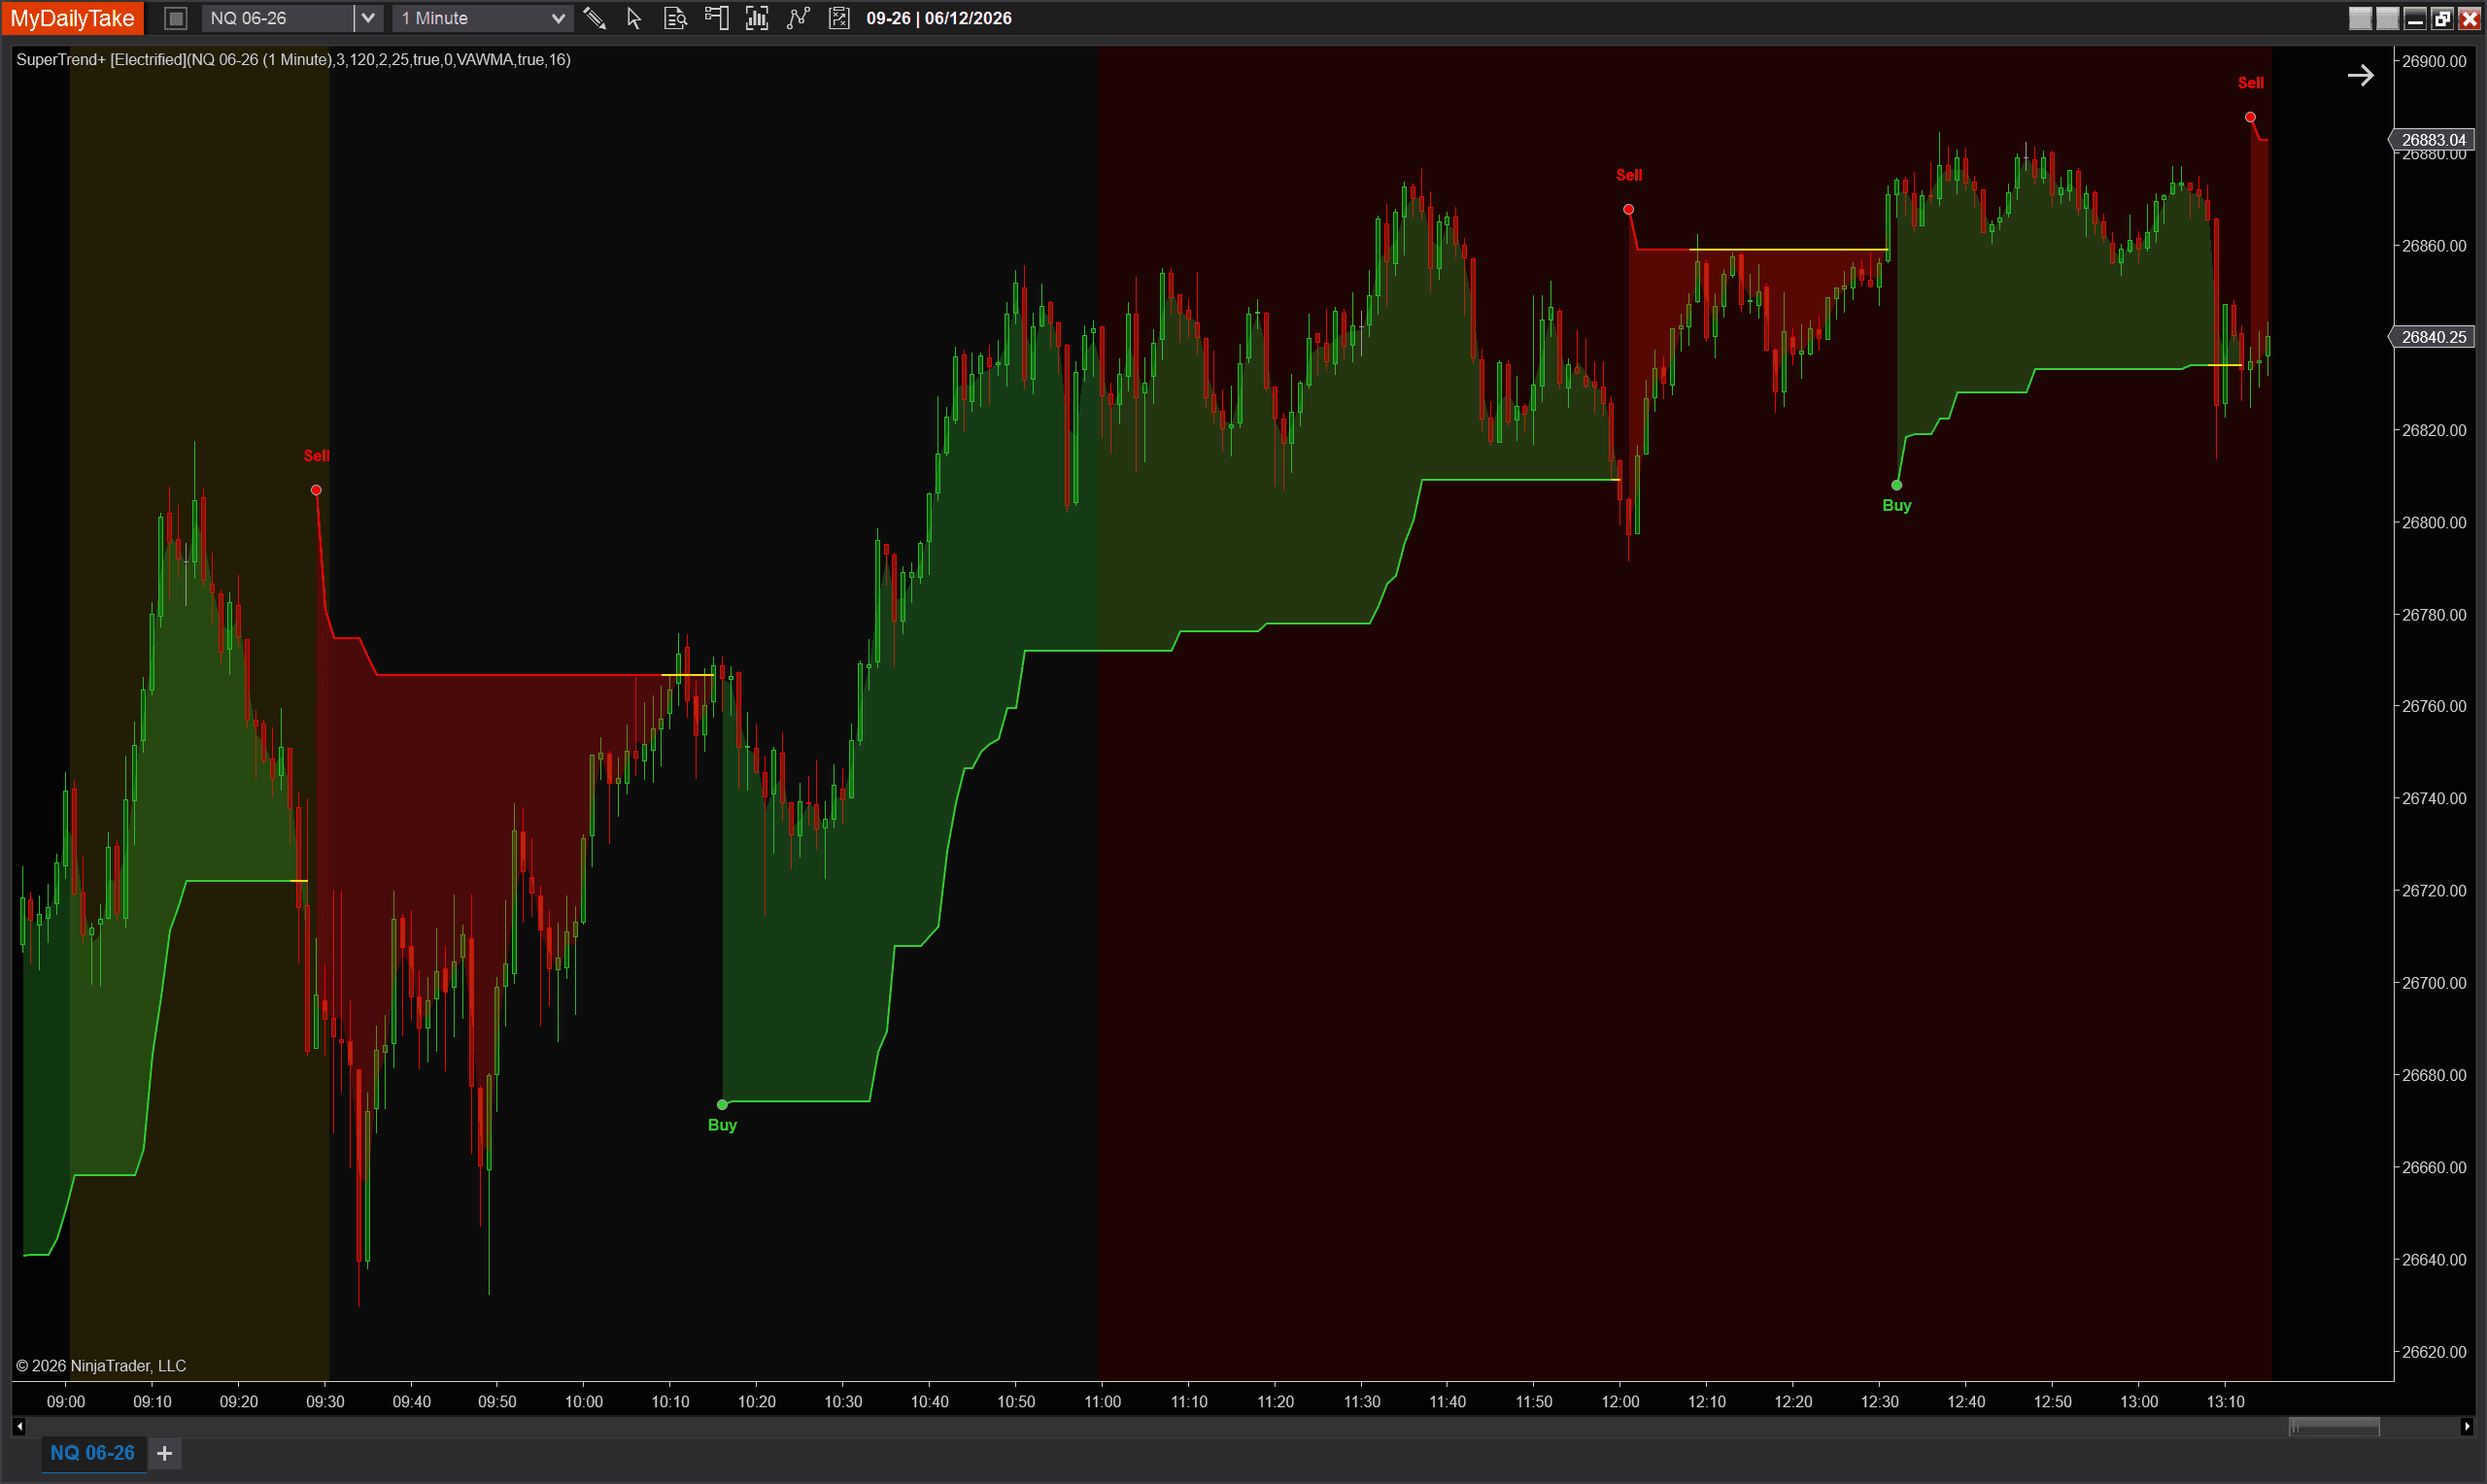
SuperTrend+ on NQ 06-26, 1-minute chart with default settings (VAWMA mode, 120-period ATR, 3.0 multiplier, 2-bar confirmation). The green fill shows the uptrend zone between the support line and OHLC4 midline; the red fill shows the downtrend zone. Buy and Sell labels mark each confirmed reversal with dot markers at the new trend level. Notice the yellow unconfirmed line segment around 12:30 — the indicator detected price crossing the band but waited for confirmation before committing to the flip.
🎉 Prop Trading Discounts
💥89% off at Bulenox.com with the code MDT89
The original Pine Script™ code is by Electrified and is licensed under the Mozilla Public License 2.0. This NinjaTrader 8 adaptation is by MyDailyTake.com. The use of Electrified’s name or adapted code does not imply endorsement by the original author.