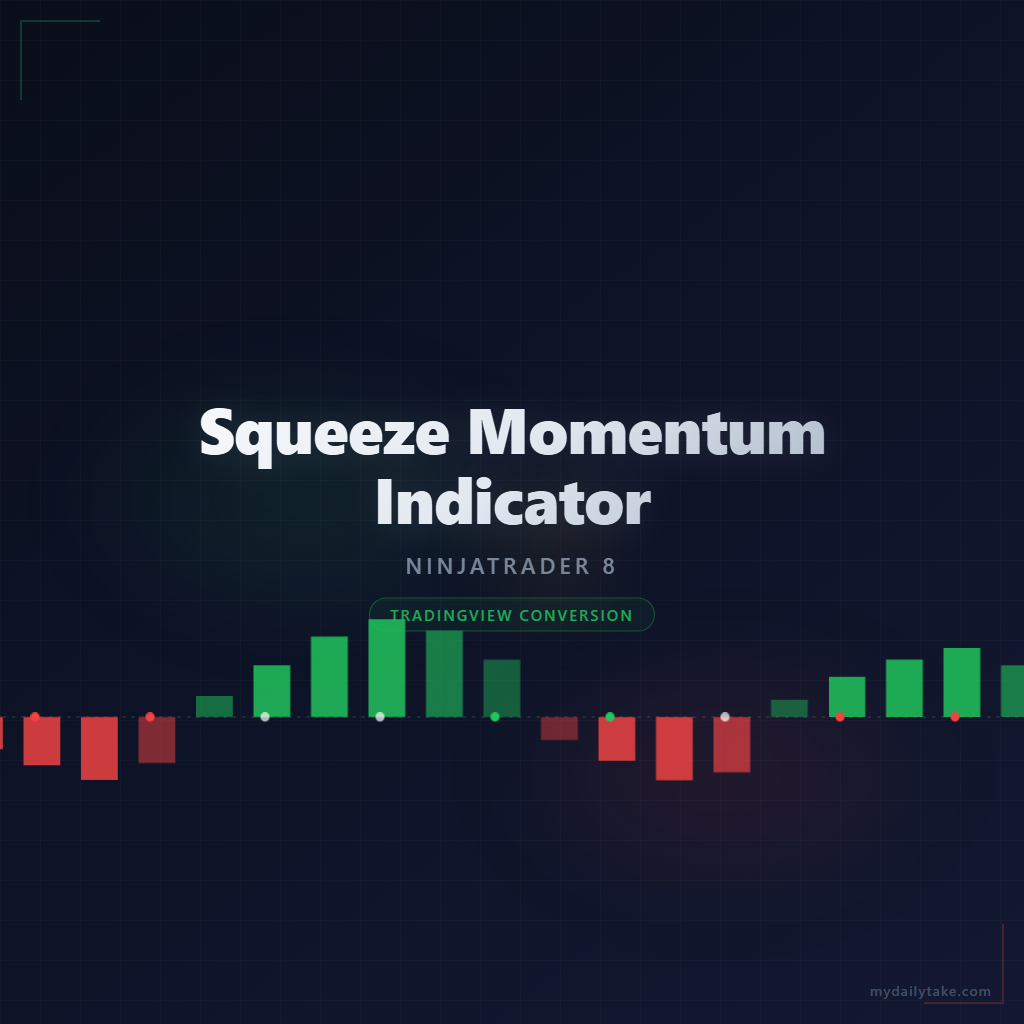
TradingView Squeeze Momentum [LazyBear] Conversion to NinjaTrader 8
If you’ve ever watched a market grind sideways for thirty bars and then explode in one direction without warning, the Squeeze Momentum Indicator is built for exactly that moment. It tells you when volatility is being compressed — Bollinger Bands locked inside a Keltner Channel — and which direction momentum is leaning when the compression releases.
The original Pine Script is by LazyBear, one of TradingView’s most prolific public-script authors, and is itself a derivative of John Carter’s TTM Squeeze concept. It’s been on TradingView for years with a huge following because the signal is simple, visual, and frequently right at turning points.
This post is the NinjaTrader 8 conversion. The full source compiles standalone in indTradingView/, exposes the squeeze and momentum signals as Series<> outputs for strategy use, and is yours to download as a NinjaScript Archive.
Original Pine Script: Squeeze Momentum Indicator [LazyBear]
License: Mozilla Public License 2.0 (MPL 2.0)
🆚 What Makes Squeeze Momentum Different from Standard Momentum
If you’ve used MACD, the Awesome Oscillator, or RSI, you know what a momentum indicator looks like — a curve or histogram telling you whether buyers or sellers are in control right now.
Squeeze Momentum adds two things on top of momentum that change how you read it:
A volatility-compression detector. The indicator constantly compares Bollinger Bands and Keltner Channels around the same price. When the Bollinger Bands sit inside the Keltner Channel, volatility is compressed — the squeeze is “on.” When the Bollinger Bands break outside the Keltner Channel, the squeeze “fires” off, signaling the start of an expansion move. The cross marker at the zero line tells you the current state at a glance: black for squeeze on, gray for squeeze off (firing), blue for neither.
A four-state momentum histogram. The histogram bars aren’t just positive or negative — each bar carries one of four colors that encodes both direction and rate-of-change:
- Lime (positive and rising): bullish momentum is accelerating.
- Green (positive but falling): still bullish, but losing steam.
- Red (negative and falling): bearish momentum is accelerating.
- Maroon (negative but rising): still bearish, but losing steam.
The pairing matters. A squeeze that fires while the histogram is lime is a strong bullish breakout setup. A squeeze that fires while the histogram is green is a momentum-fading setup that often whipsaws. Reading the colors in context is what separates this indicator from a simple “buy when the line crosses zero” tool.
⚙️ Settings
The indicator exposes two property groups: the calculation inputs that drive the squeeze and momentum math, and the seven color brushes that map each state to its on-chart color. All of these are configurable from the standard NinjaTrader properties dialog.
Indicator Setup
| Parameter | Default | Description |
|---|---|---|
| BB Length | 20 | Period for the Bollinger Band SMA and standard deviation used to detect compression. |
| KC Length | 20 | Period for the Keltner Channel midline and range used to detect compression and to compute the linear-regression momentum window. |
| KC Mult | 1.5 | Multiplier on the Keltner range (and on the Bollinger standard deviation) when computing the upper and lower bands. |
| Use True Range (KC) | True | When enabled, Keltner range uses True Range (matches LazyBear's default). When disabled, range uses High − Low. |
Display
| Parameter | Default | Description |
|---|---|---|
| Momentum Up Rising | Lime | Histogram bar color when momentum is positive and increasing. Strongest bullish signal. |
| Momentum Up Falling | Green | Histogram bar color when momentum is positive but decreasing. Bullish but fading. |
| Momentum Down Falling | Red | Histogram bar color when momentum is negative and decreasing. Strongest bearish signal. |
| Momentum Down Rising | Maroon | Histogram bar color when momentum is negative but increasing. Bearish but fading. |
| No Squeeze | DodgerBlue | Color of the centerline cross marker when neither squeeze-on nor squeeze-off conditions are met. |
| Squeeze On | Black | Color of the centerline cross marker when Bollinger Bands sit inside the Keltner Channel — volatility compressed. |
| Squeeze Off | Gray | Color of the centerline cross marker when Bollinger Bands have broken outside the Keltner Channel — volatility firing. |
🧠 How It Works
The core logic runs every confirmed bar and produces three independent outputs: a momentum value, a squeeze state, and the colors that visualize both.
- Bollinger Band calculation. A simple moving average and standard deviation of
Closeare computed over the BB Length window. The upper and lower bands sitKC Mult × StdDevaway from the SMA. - Keltner Channel calculation. A separate SMA of
Closeover the KC Length window forms the midline. The range — either True Range or High−Low depending on the toggle — is averaged over the same window. The Keltner upper and lower bands sitKC Mult × range_avgaway from the midline. - Squeeze state detection. Three mutually exclusive states are tested every bar:
- Squeeze On when
BB Lower > KC LowerANDBB Upper < KC Upper— Bollinger is fully inside Keltner. Volatility is compressed. - Squeeze Off when
BB Lower < KC LowerANDBB Upper > KC Upper— Bollinger has broken outside Keltner. Volatility is firing. - No Squeeze when neither of the above — a transitional state.
- Squeeze On when
- Momentum value. Inside an inline rolling window of
KC Lengthbars, the indicator subtracts a midpoint reference from the source close, then runs a linear regression on the resulting series and reads the regression’s predicted value at bar 0. The midpoint reference is the average of (highest-high, lowest-low, SMA close) — a centroid of the recent range. The output is a single signed momentum reading per bar. - Histogram color selection. The current momentum value is compared against the prior bar’s value to classify it into one of four buckets: positive-rising (lime), positive-falling (green), negative-falling (red), or negative-rising (maroon). The bar is plotted as a histogram bar with the chosen color.
- Cross marker color. The centerline cross marker reflects the current squeeze state — black when compressed, gray when firing, blue otherwise — so you can read both signals in one glance.
The indicator is non-repainting: every output is computed on the closed bar’s data and never updates after the bar confirms.
🛠️ Using It in a Strategy
Squeeze Momentum exposes its core signals as Series<> properties so any NinjaScript strategy or add-on can read them directly. The Update() wrapper inside each getter ensures the indicator is current on every read.
The most common pattern is “wait for the squeeze to fire in the direction of momentum” — you enter long when IsSqueezeOff[0] is true on the same bar that the histogram color is bullish, and short when squeeze fires while the histogram is bearish. Below is the full lifecycle: instantiate the indicator in State.DataLoaded, then read signals and momentum direction in OnBarUpdate. The public outputs are listed in a reference table after the code block.
private SqueezeMomentumLazyBear sqz;

protected override void OnStateChange()
{
    if (State == State.SetDefaults)
    {
        Name = "SqueezeMomentumStrategyExample";
    }
    else if (State == State.DataLoaded)
    {
        sqz = SqueezeMomentumLazyBear(
            20,                               // BB Length
            20,                               // KC Length
            1.5,                              // KC Mult
            true,                             // Use True Range (KC)
            Brushes.Lime,                     // Momentum Up Rising
            Brushes.Green,                    // Momentum Up Falling
            Brushes.Red,                      // Momentum Down Falling
            Brushes.Maroon,                   // Momentum Down Rising
            Brushes.DodgerBlue,               // No Squeeze
            Brushes.Black,                    // Squeeze On
            Brushes.Gray                      // Squeeze Off
        );
    }
}

protected override void OnBarUpdate()
{
    if (CurrentBar < 21) return;

    // Detect a squeeze that just fired this bar
    bool squeezeFiredThisBar = sqz.IsSqueezeOff[0] && !sqz.IsSqueezeOff[1];

    // Read momentum direction and rate-of-change
    double momNow  = sqz.Momentum[0];
    double momPrev = sqz.Momentum[1];
    bool bullishAccelerating = momNow > 0 && momNow > momPrev;
    bool bearishAccelerating = momNow < 0 && momNow < momPrev;

    if (squeezeFiredThisBar && bullishAccelerating)
        EnterLong();

    if (squeezeFiredThisBar && bearishAccelerating)
        EnterShort();
}
Every output is a Series<>, which means you can index back in time freely. sqz.IsSqueezeOn[5] checks whether the squeeze was on five bars ago. sqz.Momentum[10] reads the momentum value ten bars back. There’s no need to call Update() yourself — each getter wraps it.
Public Outputs
| Output | Type | Description |
|---|---|---|
| Momentum[0] |
Series | Linear-regression momentum value. Sign is direction; magnitude is strength. |
| IsSqueezeOn[0] |
Series | True when Bollinger Bands sit inside the Keltner Channel — volatility compressed. |
| IsSqueezeOff[0] |
Series | True when Bollinger Bands have broken outside the Keltner Channel — volatility firing. |
🔄 Conversion Notes
A few things changed in the translation from Pine Script to NinjaScript:
Linear regression on a custom expression. Pine’s linreg(source - avg(avg(highest, lowest), sma), length, 0) runs a linear regression on a derived series. NT8’s LinReg indicator works on price series only, so the conversion implements the regression inline — accumulating x, y, x², and xy sums over the rolling window and solving for the predicted value at bar zero. The output is mathematically equivalent.
Plot styles for histogram and cross marker. Pine renders the momentum bars with style=histogram and the centerline marker with style=cross. NT8 uses two AddPlot calls — one PlotStyle.Bar for the momentum histogram with per-bar PlotBrushes[] overrides for the four colors, and one PlotStyle.Dot for the squeeze marker on the zero line with per-bar color overrides for the three squeeze states.
Public Series exposure. The squeeze on/off booleans and the momentum value are exposed as Series<> outputs for strategy consumers. Strategies can index these freely — IsSqueezeOff[0] for current bar, IsSqueezeOff[1] for prior bar, etc. — to detect squeeze releases or momentum reversals without re-implementing the math.
📦 Download
The full source is available as a free NinjaScript Archive. To install:
- Download the
.zipfile below. - In NinjaTrader 8, go to Tools → Import → NinjaScript Add-On.
- Select the downloaded
.zipfile. - The indicator will appear under Indicators → indTradingView → Squeeze Momentum [LazyBear] on your chart.
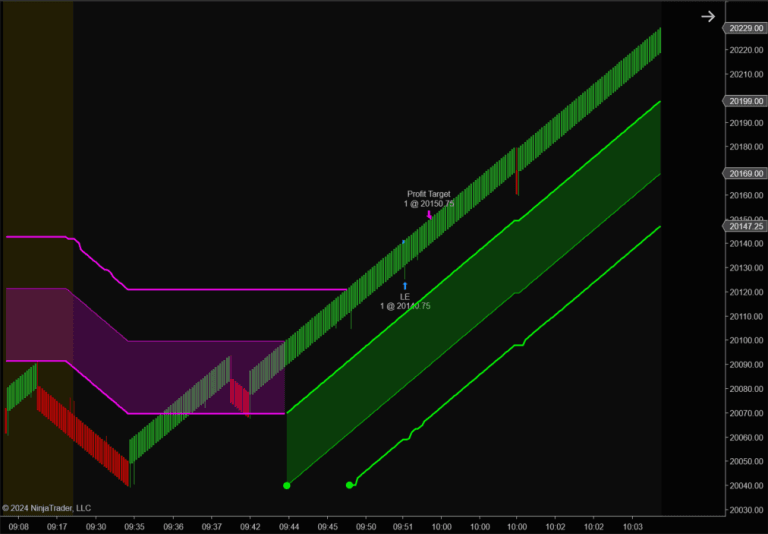
📊 Chart Example
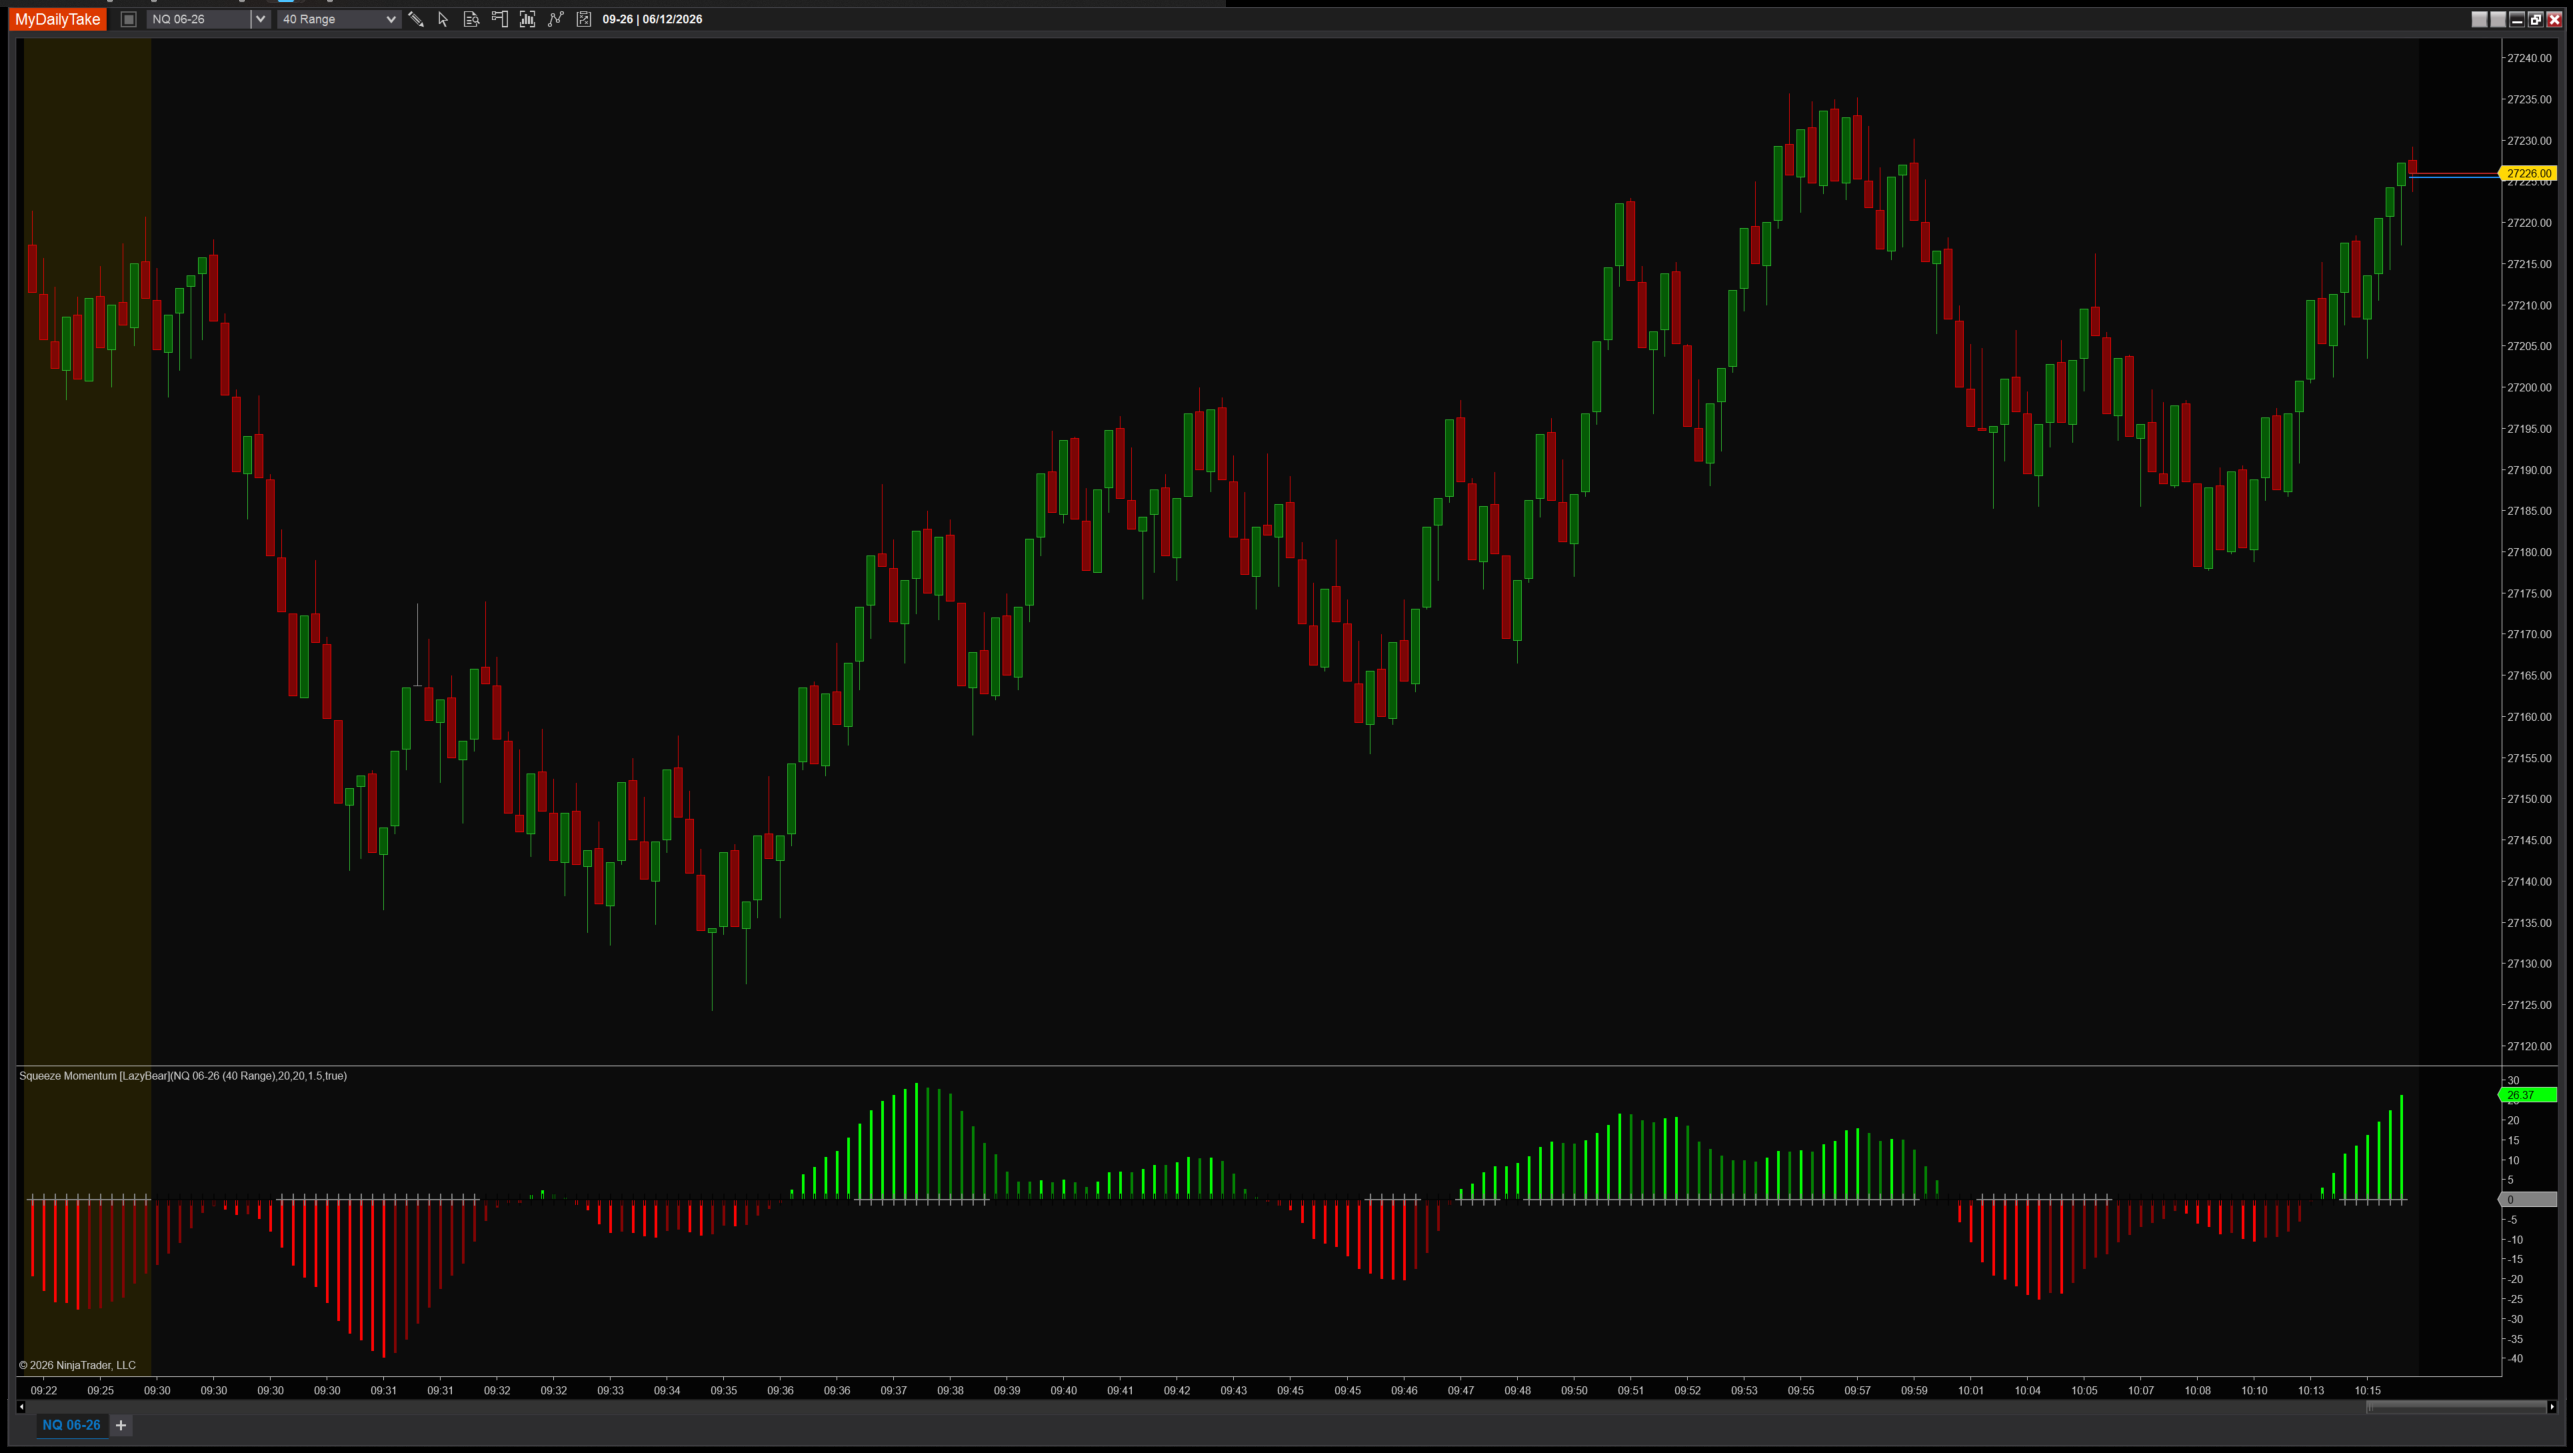
Squeeze Momentum on a 1-minute chart with default settings. The lower panel shows the four-color histogram and the centerline cross marker. Watch for the marker color changing from black (squeeze on) to gray (squeeze off) — that’s the fire signal — while reading the histogram color to confirm direction. Bars where the marker turns gray and the histogram is lime are the cleanest bullish breakouts; bars where it turns gray with red bars are the cleanest bearish breakouts.
🎉 Prop Trading Discounts
💥89% off at Bulenox.com with the code MDT89
The original Pine Script™ code is by LazyBear and is licensed under the Mozilla Public License 2.0. This NinjaTrader 8 adaptation is by MyDailyTake.com. The use of LazyBear’s name or adapted code does not imply endorsement by the original author.