
TradingView CM Williams Vix Fix [ChrisMoody] Conversion to NinjaTrader 8
The original Williams Vix Fix is one of the cleverest technical indicators ever published — it reverse-engineers the VIX’s bottom-finding behavior and applies it to instruments that don’t have a real VIX. Larry Williams built it so traders could spot capitulation bottoms in stocks, futures, and forex using volatility-of-range math instead of options-derived volatility.
ChrisMoody’s TradingView adaptation puts a tighter filter on top: instead of just plotting the raw histogram, it overlays a Bollinger Band and a 50-bar percentile range, then highlights bars where the VixFix punches through both — those are the high-probability bottom signals.
This post is the NinjaTrader 8 conversion. The full source compiles standalone in indTradingView/, exposes the histogram and the highlight band as Series<> outputs for strategy use, and is yours to download as a NinjaScript Archive.
Original Pine Script: CM Williams Vix Fix by ChrisMoody
License: Mozilla Public License 2.0 (MPL 2.0)
🆚 What Makes the Williams Vix Fix Different
Most volatility indicators tell you when volatility is high or low. The Williams Vix Fix tells you when the fear in the market is so high that a bottom is statistically near. The math is simple: take the highest close over a lookback window, subtract the current low, then divide by the highest close. The result spikes when price has dropped sharply from a recent high — exactly when traders are panicking.
ChrisMoody’s enhancement adds two filter layers. A Bollinger Band drawn around the VixFix histogram catches readings beyond N standard deviations — those are the statistical outliers. A 50-bar percentile range catches readings in the top 15% of recent history. When both filters fire together, the bar gets a green highlight color — that’s the bottom-confirmation signal.
⚙️ Settings
Williams Vix Fix exposes its inputs in two property groups: the calculation parameters (lookback windows, Bollinger and percentile thresholds), and the two display colors that distinguish highlighted bottom-confirmation bars from normal histogram bars.
Indicator Setup
| Parameter | Default | Description |
|---|---|---|
| LookBack Std Dev | 22 | Lookback window for the Williams VixFix calculation — highest close over this many bars sets the upper reference. |
| Bollinger Length | 20 | Period for the Bollinger Band drawn around the VixFix histogram. |
| BB Multiplier | 2.0 | Standard deviation multiplier for the Bollinger Band's upper threshold. |
| LookBack Percentile | 50 | Lookback for the percentile-range filter (Williams' second filter layer). |
| High Percentile | 0.85 | Top-N% threshold for the percentile filter. 0.85 = top 15% of recent VixFix readings. |
| Low Percentile | 1.01 | Lower-bound multiplier (compounds with High Percentile to compute the highlight threshold). |
| Show High Range | True | Render the percentile range as a horizontal reference. |
| Show Std Dev Line | True | Render the upper Bollinger Band line as a reference. |
Display
| Parameter | Default | Description |
|---|---|---|
| Highlight Color | Lime | Histogram bar color when both the Bollinger and percentile filters fire — high-conviction bottom signal. |
| Normal Color | Gray | Histogram bar color on bars that don't meet the dual-filter condition. |
🧠 How It Works
The core logic runs every confirmed bar and produces four series — the histogram, two filter thresholds, and a highlight flag for chart coloring.
- VixFix histogram. For each bar, take the highest close over the LookBack Std Dev window, subtract the current low, then divide by the highest close — multiplied by 100 to scale. The result spikes when price drops sharply from a recent high.
- Bollinger Band threshold. Compute SMA and standard deviation of the histogram over the Bollinger Length window. The upper band sits at
SMA + (BB Multiplier × StdDev)— readings above this are statistical outliers. - Percentile range. Track the highest VixFix value over the LookBack Percentile window. The range upper edge is
highest × High Percentile; the lower edge isupper × Low Percentile. Readings between these are in the top-N% historically. - Highlight gate. A bar is highlighted only when the histogram exceeds BOTH the Bollinger upper band AND the percentile range. Either condition alone isn’t enough — the dual filter is the whole point.
- Plot output. The histogram is rendered with per-bar color overrides — Highlight Color when the gate fires, Normal Color otherwise. The two threshold lines are optional reference plots controlled by the Show High Range and Show Std Dev Line toggles.
The indicator is non-repainting: every value is computed on the closed bar’s data and never updates after the bar confirms.
🛠️ Using It in a Strategy
The Williams Vix Fix exposes its histogram and threshold series for any NinjaScript strategy. The most common pattern is to enter long when the histogram first exceeds both filter thresholds — that’s the highlight bar — and exit on the next bar that drops back below the upper Bollinger Band.
Below is the lifecycle: instantiate in State.DataLoaded, then in OnBarUpdate check whether the current bar is a highlight bar and act on it.
private CmWilliamsVixFix vix;

protected override void OnStateChange()
{
    if (State == State.SetDefaults)
    {
        Name = "WilliamsVixFixStrategyExample";
    }
    else if (State == State.DataLoaded)
    {
        vix = CmWilliamsVixFix(
            22,                  // LookBack Std Dev
            20,                  // Bollinger Length
            2.0,                 // BB Multiplier
            50,                  // LookBack Percentile
            0.85,                // High Percentile
            1.01,                // Low Percentile
            true,                // Show High Range
            true,                // Show Std Dev Line
            Brushes.Lime,        // Highlight Color
            Brushes.Gray         // Normal Color
        );
    }
}

protected override void OnBarUpdate()
{
    if (CurrentBar < 50) return;

    // A "highlight bar" is one where the VixFix exceeds BOTH filters
    bool highlightBar =
        vix.WilliamsVixFix[0] >= vix.UpperBand[0] &&
        vix.WilliamsVixFix[0] >= vix.RangeHigh[0];

    bool isFirstSignal = highlightBar &&
        !(vix.WilliamsVixFix[1] >= vix.UpperBand[1] &&
          vix.WilliamsVixFix[1] >= vix.RangeHigh[1]);

    if (isFirstSignal)
    {
        // First highlight bar after a quiet stretch — bottom-finder signal
        EnterLong();
    }

    // Exit when VixFix drops back below the Bollinger upper band
    if (Position.MarketPosition == MarketPosition.Long &&
        vix.WilliamsVixFix[0] < vix.UpperBand[0])
    {
        ExitLong();
    }
}
Every output is a Series<>, so you can index back in time freely and the Update() wrapper inside each getter handles sync.
Public Outputs
| Output | Type | Description |
|---|---|---|
| WilliamsVixFix[0] |
Series | The raw VixFix histogram value — proportional to (highest close − current low) / highest close. |
| UpperBand[0] |
Series | The Bollinger Band upper threshold for the histogram. |
| RangeHigh[0] |
Series | The percentile-filter upper threshold (top-N% line). |
| RangeLow[0] |
Series | The percentile-filter lower threshold. |
🔄 Conversion Notes
A few things changed in the translation from Pine Script to NinjaScript:
Histogram color via PlotBrushes. Pine renders the histogram with a single conditional color expression. NT8 uses a single AddPlot with PlotStyle.Bar and per-bar PlotBrushes[0][0] assignment — the highlight gate is evaluated each bar and the brush is swapped accordingly.
Threshold lines as separate plots. The Bollinger upper band and the percentile range are rendered as their own AddPlot calls so users can toggle them off via the Show flags. Pine’s plot() with display=display.none on a toggled flag is replaced with Values[i].Reset() when disabled.
Series-based public outputs. The four plot values (WilliamsVixFix, UpperBand, RangeHigh, RangeLow) are exposed as plot-backed Series<double> for strategy consumers. Strategies can build a ‘highlight bar this bar’ check by comparing WilliamsVixFix[0] against the two threshold series.
📦 Download
The full source is available as a free NinjaScript Archive. To install:
- Download the
.zipfile below. - In NinjaTrader 8, go to Tools → Import → NinjaScript Add-On.
- Select the downloaded
.zipfile. - The indicator will appear under Indicators → indTradingView → CM Williams Vix Fix [ChrisMoody] on your chart.
📊 Chart Example
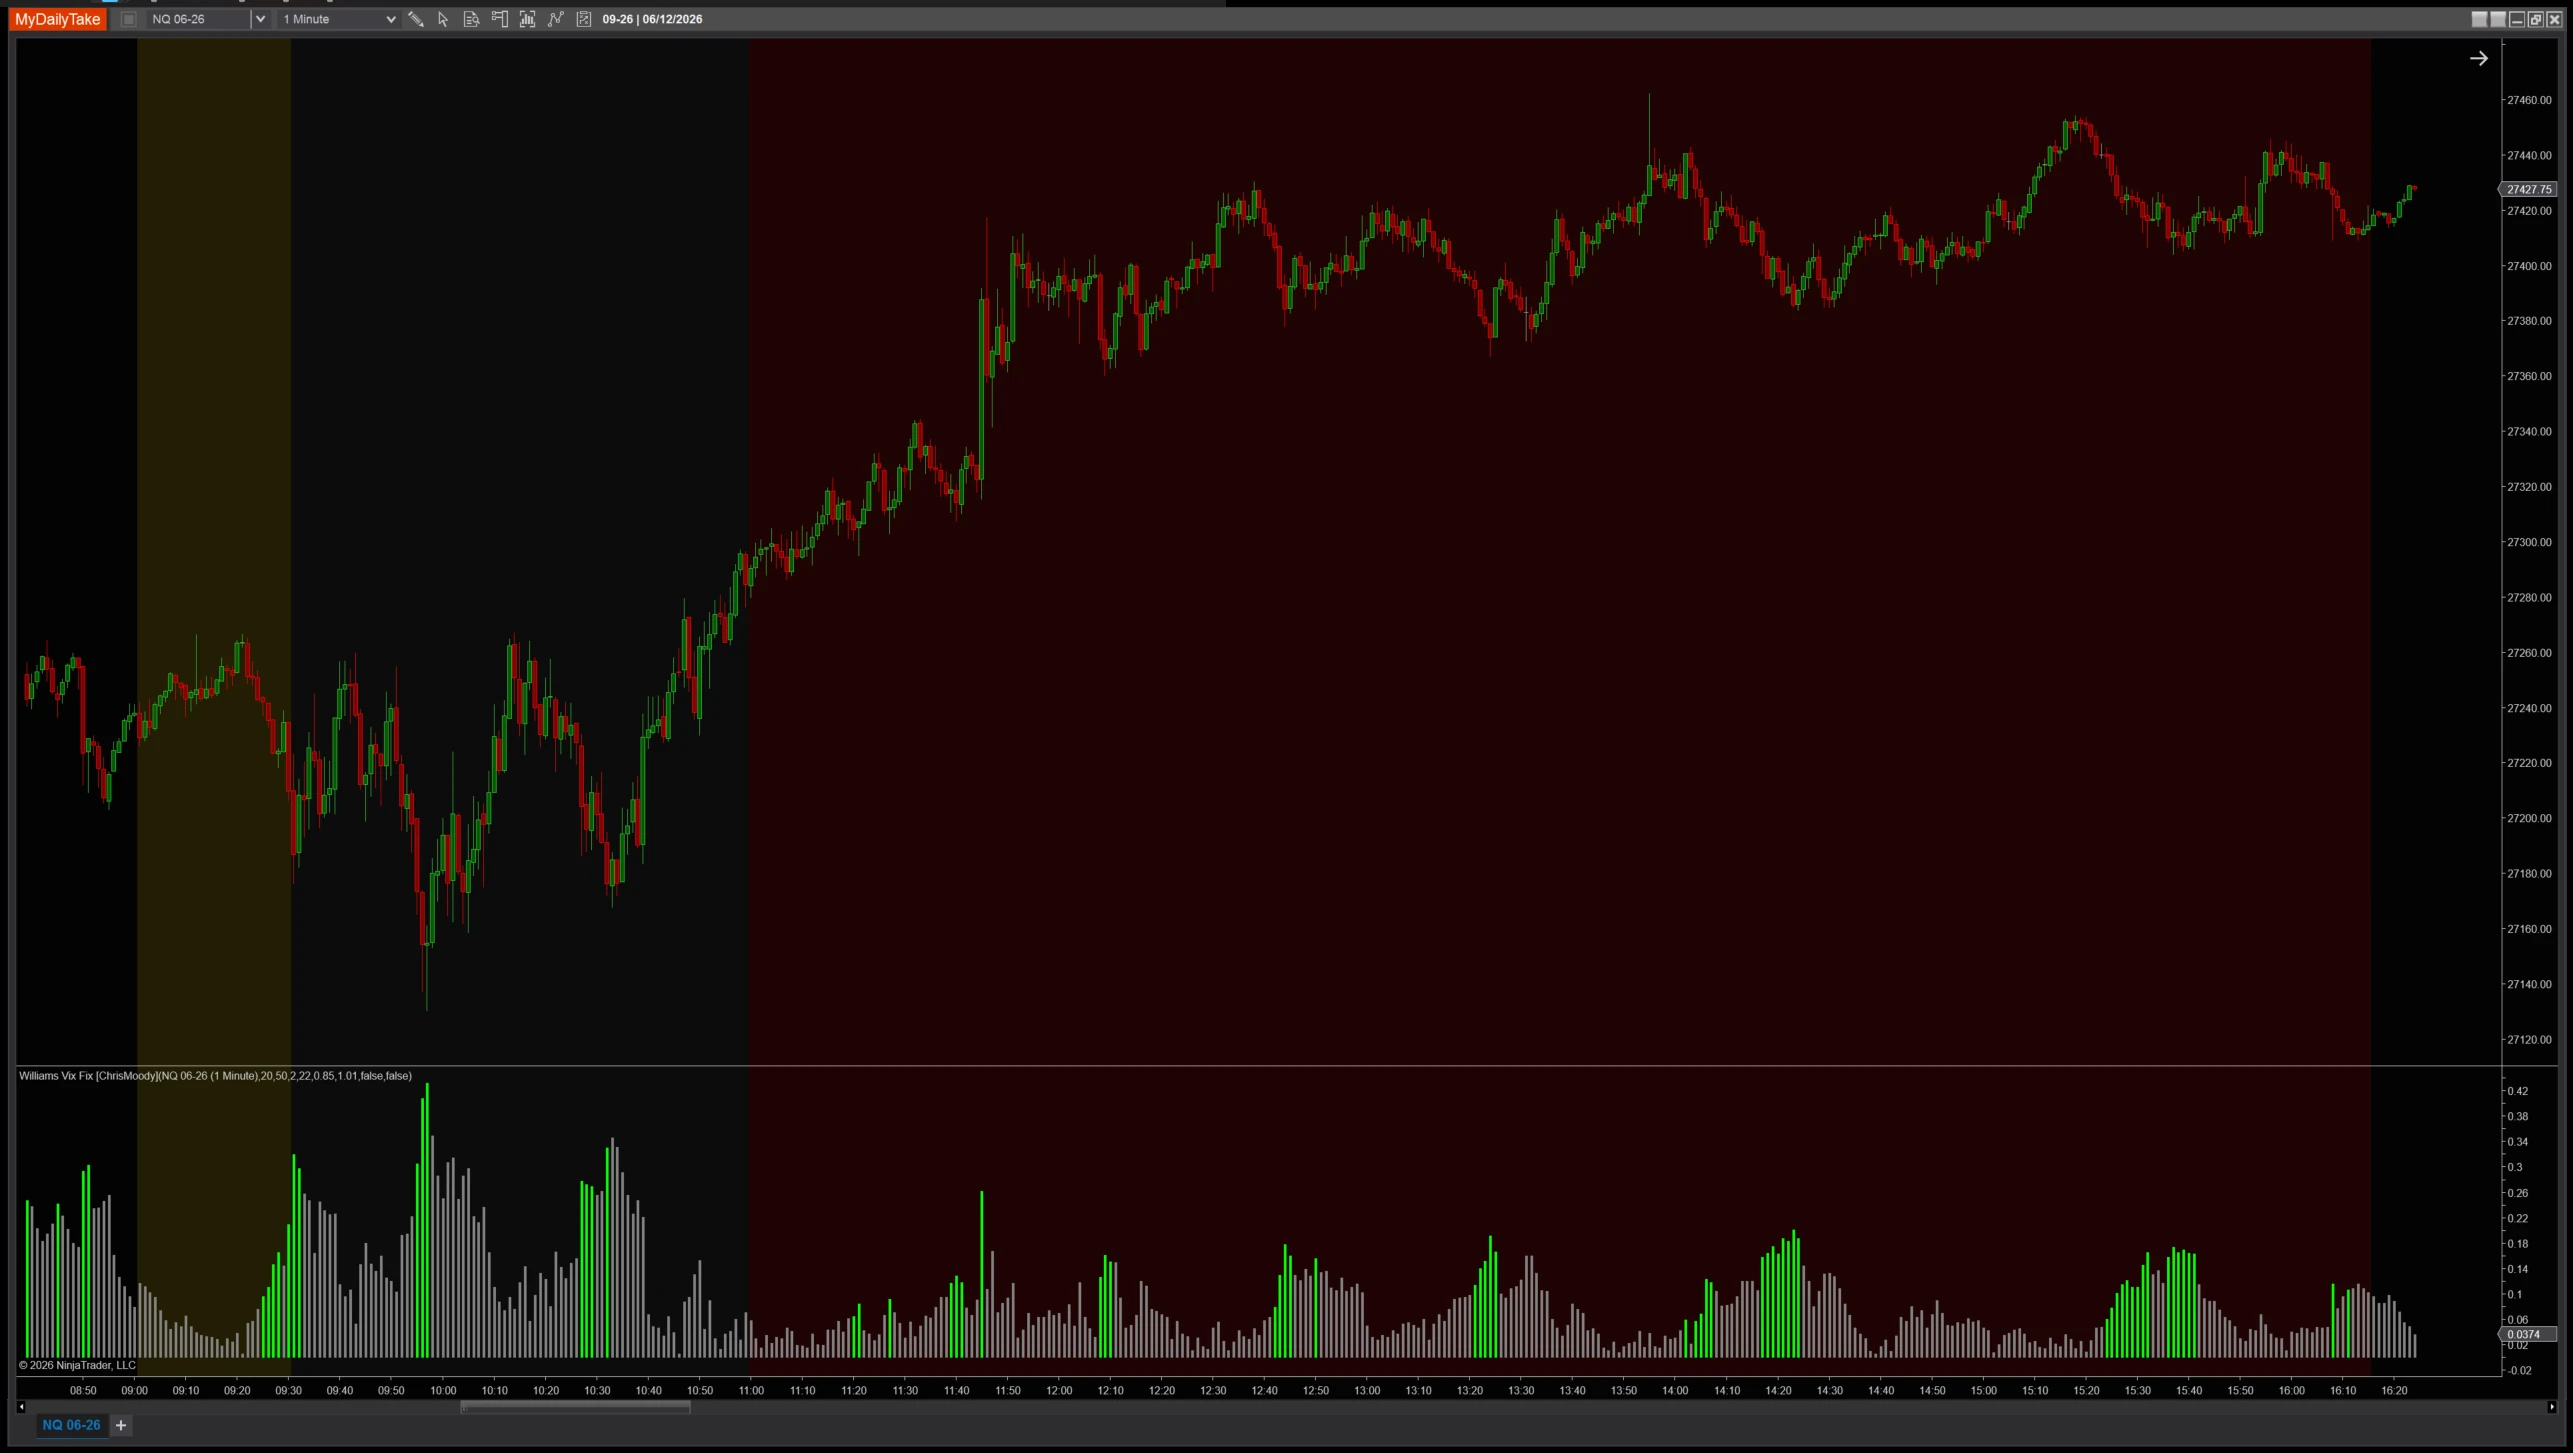
CM Williams Vix Fix on a 1-minute chart with default settings. The gray histogram is the raw VixFix reading; the green bars are the highlight events where both the Bollinger Band filter and the 50-bar percentile range agree on a high-conviction bottom signal. Notice how clean the green bars cluster at swing lows compared to the surrounding noise.


The original Pine Script™ code is by ChrisMoody and is licensed under the Mozilla Public License 2.0 (MPL 2.0). This NinjaTrader 8 adaptation is by MyDailyTake.com. The use of ChrisMoody’s name or adapted code does not imply endorsement by the original author.
