TradingView RSI With Noise Elimination Technology [alexgrover] Conversion to NinjaTrader 8
John Ehlers’ Noise Elimination Technology (NET) sits on top of any oscillator and outputs how directional its recent values have been — values close to ±1 indicate a clear trend in the underlying, values near zero indicate noise. alexgrover’s RSI With Noise Elimination applies it to a normalized momentum oscillator (an efficiency-ratio form of RSI), so what you see is the RSI you expect, plus a NET line that says ‘this RSI move is signal, not noise.’
Two plots: NET (the Kendall rank correlation coefficient) and the underlying normalized RSI. Both oscillate around zero. NET is the cleaner, more interpretable line; RSI is the raw signal that NET is reading.
This post is the NinjaTrader 8 conversion. The full source compiles standalone in indTradingView/, exposes both lines as Series<double> outputs for strategy use, and is yours to download as a NinjaScript Archive.
Original Pine Script: RSI With Noise Elimination Technology by alexgrover
License: Mozilla Public License 2.0 (MPL 2.0)
🆚 What Makes RSI With Noise Elimination Different
Standard RSI on raw price gives you a value bounded in [0, 100]. Useful, but with no signal/noise distinction — a 60 reading could be a strong trend or two days of meandering. Ehlers’ NET attaches a noise filter directly to the underlying oscillator: by computing the rank correlation of recent values, it asks ‘are these values monotonically rising / falling, or jumbled?’
Kendall rank correlation as a clean filter. The NET line is the rolling Kendall tau coefficient over the underlying oscillator. Tau = +1 means every value is greater than the previous (perfect uptrend), tau = −1 means every value is lower (perfect downtrend), tau ≈ 0 means the values are unordered. The NET line lives in [−1, 1] and reads as a noise-free directional indicator.
Normalized momentum, not Wilder’s RSI. The ‘RSI’ here is Ehlers’ efficiency-ratio form: (price − price[N]) / sum(|price[k] − price[k+1]|). It lives in [−1, 1] (not [0, 100]) and naturally centers on zero. So both plots share the same axis, no scaling normalizations needed.
⚙️ Settings
RSI With Noise Elimination is a minimal indicator — just two parameters in a single property group: the lookback for the underlying normalized RSI, and the window size for the NET kernel.
Indicator Setup
| Parameter | Default | Description |
|---|---|---|
| RSI Length | 14 | Lookback period for the normalized momentum oscillator (Ehlers efficiency ratio). |
| NET Length | 14 | Window size for the Kendall rank correlation kernel applied to the normalized RSI. |
🧠 How It Works
Each bar runs two stages: the normalized RSI on input, then the Kendall rank correlation kernel on the RSI history.
- Normalized momentum oscillator. Numerator = Input[0] − Input[RsiLength]. Denominator = sum of |Input[k] − Input[k+1]| for k = 0..RsiLength−1. RSI = numerator / denominator. The output is bounded in [−1, 1] — Ehlers’ efficiency-ratio form, not the [0..100] Wilder version.
- NET kernel. For each pair (i, j) where 0 < j ≤ i ≤ NetLength−1, compute the sign of myRsi[i] − myRsi[i − j]. Sum the negative-signs and subtract the positive-signs (the Kendall convention). The total is divided by N(N−1)/2 to get the Kendall rank correlation tau in [−1, 1].
- Why this works. Each pair contributes +1 if the more-recent value is higher, −1 if lower, 0 if equal. A monotonically rising sequence puts every pair at +1 — tau = +1. A monotonically falling sequence puts every pair at −1 — tau = −1. A jumbled sequence cancels out around zero. So the NET line is a direct measurement of how monotone the recent oscillator history has been.
- Plot routing. NET goes to plot 0 (blue), Rsi goes to plot 1 (red). A zero hline anchors the panel — both lines straddle it. The two plots share the same vertical scale because both live in [−1, 1].
The indicator is non-repainting. The Kendall kernel reads only closed-bar history of the underlying RSI series.
🛠️ Using It in a Strategy
RSI With Noise Elimination is most useful as a quality-of-trend filter on top of another signal generator. The example below uses it standalone: enter long when both NET and RSI are positive (clean uptrend confirmed by both lines), exit when NET drops back through zero. Symmetric for shorts.
Below is the lifecycle: instantiate in State.DataLoaded, then in OnBarUpdate watch for the NET / RSI agreement above or below zero.
private RsiNoiseElimination rne;

protected override void OnStateChange()
{
    if (State == State.SetDefaults)
    {
        Name = "RsiNoiseEliminationStrategyExample";
    }
    else if (State == State.DataLoaded)
    {
        rne = RsiNoiseElimination(
            14,    // RSI Length
            14     // NET Length
        );
    }
}

protected override void OnBarUpdate()
{
    if (CurrentBar < 30) return;

    double net0 = rne.Net[0];
    double net1 = rne.Net[1];
    double rsi0 = rne.Rsi[0];

    // Both lines agreeing above zero = confirmed uptrend; both below = confirmed downtrend
    bool armedLong  = net0 > 0 && rsi0 > 0 && net1 <= 0;
    bool armedShort = net0 < 0 && rsi0 < 0 && net1 >= 0;

    if (armedLong  && Position.MarketPosition != MarketPosition.Long)  EnterLong();
    if (armedShort && Position.MarketPosition != MarketPosition.Short) EnterShort();

    // Exit when NET returns to neutral
    if (Position.MarketPosition == MarketPosition.Long  && net0 < 0) ExitLong();
    if (Position.MarketPosition == MarketPosition.Short && net0 > 0) ExitShort();
}
Both outputs are Series<>. rne.Net[0] reads the current Kendall tau; rne.Net[1] the prior bar’s value, useful for cross detection.
Public Outputs
| Output | Type | Description |
|---|---|---|
| Net[0] |
Series | Kendall rank correlation in [−1, 1]. Near +1 = clean uptrend; near −1 = clean downtrend; near 0 = noise. |
| Rsi[0] |
Series | Underlying normalized momentum oscillator (efficiency ratio). In [−1, 1]. |
🔄 Conversion Notes
A few things changed in the translation from Pine Script to NinjaScript:
Normalized RSI implemented inline. NT8’s RSI primitive is Wilder’s [0..100] form. The Pine source uses Ehlers’ efficiency-ratio form, which lives in [−1, 1]. The conversion implements it inline as a per-bar numerator / denominator pair so the output matches the Pine plot exactly.
Kendall kernel inlined. The NET kernel is an O(NetLength²) double loop per bar — fine on default 14, but watch the configured value if you push it large. The implementation reads myRsiSeries[i] with i up to NetLength − 1, so the underlying series is allocated with MaximumBarsLookBack.Infinite to handle any user-configurable size.
Two plots, no overlay. Pine’s two plot() calls become two AddPlot calls. Both share a zero AddLine reference — the [−1, 1] range is implicit, no overbought / oversold marks since the indicator’s nature is signal-vs-noise, not extremes.
Series-based public outputs. Net and Rsi are both exposed as Series<double> via the standard NT8 Values[i] getter — index back any number of bars freely from a strategy.
📦 Download
The full source is available as a free NinjaScript Archive. To install:
- Download the
.zipfile below. - In NinjaTrader 8, go to Tools → Import → NinjaScript Add-On.
- Select the downloaded
.zipfile. - The indicator will appear under Indicators → indTradingView → RSI With Noise Elimination Technology [alexgrover] on your chart.
📊 Chart Example
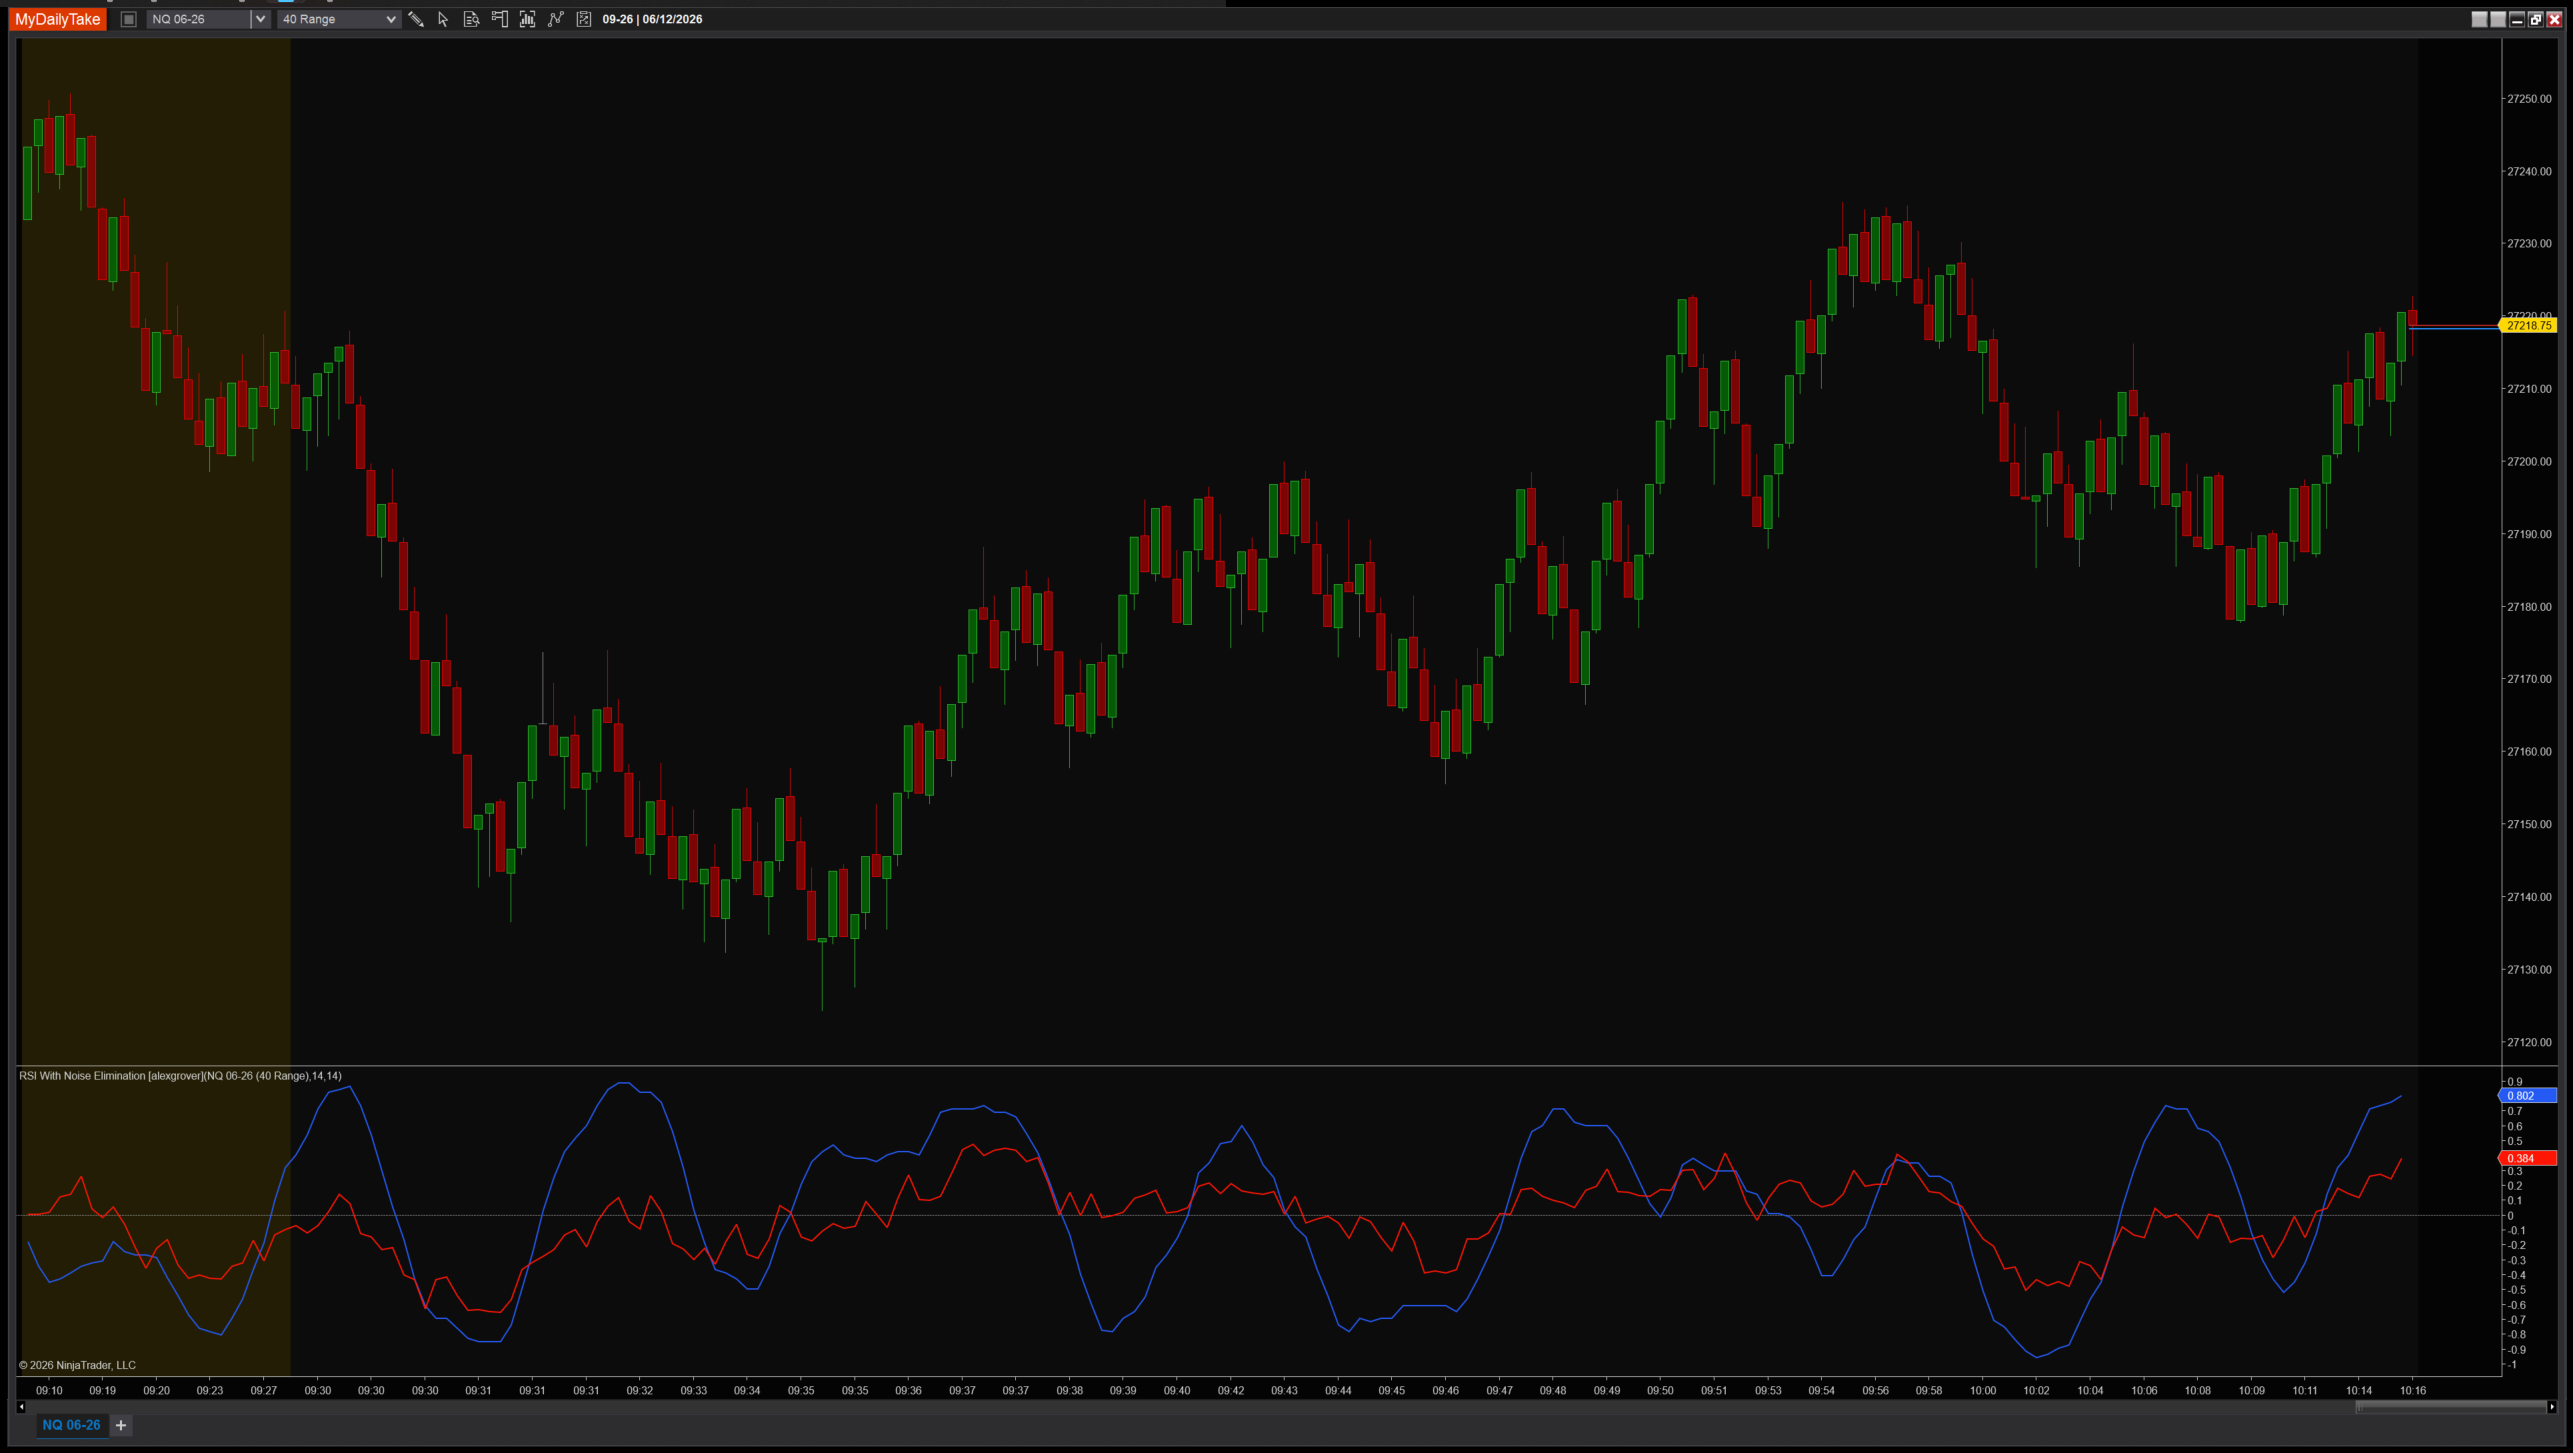
RSI With Noise Elimination on a 1-minute chart with default settings (RSI=14, NET=14). The blue NET line is the cleaner, more directional signal — values near ±1 indicate a strong trend in the underlying RSI; values near zero indicate noise. The red RSI line is the raw normalized oscillator that NET is reading. Both swing through zero on the same vertical scale.


The original Pine Script™ code is by alexgrover and is licensed under the Mozilla Public License 2.0 (MPL 2.0). This NinjaTrader 8 adaptation is by MyDailyTake.com. The use of alexgrover’s name or adapted code does not imply endorsement by the original author.