RSI Dynamic Levels — Constance Brown Regime-Aware Thresholds
The default 30/70 RSI thresholds you see in every charting platform were calibrated by J. Welles Wilder in 1978 on flat, range-trading markets. They are mathematically wrong in a trending market — and Constance Brown made that case decades ago in Technical Analysis for the Trading Professional. In a sustained bull, RSI rarely drops below 40 and pullbacks bottom out around there. In a sustained bear, RSI rarely exceeds 60 and rallies top out around there. If you are using 30 as oversold during a strong uptrend you will miss most of the high-probability long entries; if you are using 70 as overbought during a downtrend you will keep getting run over.
This indicator implements Brown’s dynamic-threshold RSI for NinjaTrader 8. It detects regime via a configurable moving average with hysteresis, then swaps the overbought/oversold pair based on the active regime — Bull = 40/80, Bear = 20/60. Includes a regime-tinted bar background, the RSI line, dynamic upper/lower threshold lines, and public Series outputs so a strategy can read the regime + cross signals directly.
🆚 Why 30/70 RSI Is Wrong in Trends
Brown’s research, repeated across decades of equity data, found that RSI behaves differently in different regimes. The cleanest summary:
- In a bull regime, RSI rarely falls below 40 and routinely tags 80 on rallies. The actionable range is 40–80.
- In a bear regime, RSI rarely exceeds 60 and routinely tags 20 on selloffs. The actionable range is 20–60.
- The default 30/70 band only describes a sideways/range market — exactly the regime where mean-reversion oscillators are easiest to trade and least informative.
The fix is to detect what regime you are in and use the correct threshold pair. That is what this indicator does.
⚙️ Settings
Settings are organized into five groups: RSI for the oscillator period, Regime for how the bull/bear classification is detected, Bull Levels and Bear Levels for the dynamic threshold pairs, and Display for the visual options including the regime background tint.
RSI
| Parameter | Default | Description |
|---|---|---|
| RSI Period | 14 | Lookback period for the RSI calculation. Wilder’s original = 14. |
Regime
| Parameter | Default | Description |
|---|---|---|
| Regime MA Period | 50 | Lookback for the regime-detection moving average. Brown referenced 200 for daily; 50 is more responsive intraday. |
| Regime MA Type | EMA | EMA reacts faster to regime changes; SMA gives smoother, slower flips. |
| Regime Flip Bars | 3 | Number of consecutive bars on one side of the MA before regime flips. Acts as hysteresis to prevent whipsaws when price wiggles around the MA. |
Bull Levels
| Parameter | Default | Description |
|---|---|---|
| Bull Upper (Overbought) | 80 | Overbought threshold while in a bull regime. Brown’s research figure. |
| Bull Lower (Oversold) | 40 | Oversold threshold while in a bull regime. Brown showed RSI rarely drops below 40 in trending bulls — 30 misses most pullback entries. |
Bear Levels
| Parameter | Default | Description |
|---|---|---|
| Bear Upper (Overbought) | 60 | Overbought threshold while in a bear regime. Brown showed RSI rarely exceeds 60 in trending bears — 70 misses most rip-up shorts. |
| Bear Lower (Oversold) | 20 | Oversold threshold while in a bear regime. Brown’s research figure. |
Display
| Parameter | Default | Description |
|---|---|---|
| Show Midline (50) | true | Render the horizontal 50 line as the RSI’s centerline reference. |
| Show Regime Background | true | Tint the chart’s bar columns with a subtle bull/bear color reflecting the detected regime. |
| Background Alpha | 12 | Opacity of the regime tint (0 = invisible, 100 = solid). 12 is intentionally subtle. |
| Bull Background Color | LightGreen | Color of the bull-regime bar tint. |
| Bear Background Color | LightCoral | Color of the bear-regime bar tint. |
🧠 How It Works
- Calculate the RSI. Standard Wilder RSI on the configured period. Default 14 — the only period most charting platforms ship with.
- Detect the regime. A configurable moving average (default 50-period EMA) is computed on the close. If price is above the MA, the desired regime is bull; if below, bear. The MA period and type are tuneable — 50/EMA suits intraday, 200/SMA matches Brown’s daily-chart context.
- Apply hysteresis to prevent whipsaws. Price that flickers across the MA on every other bar would otherwise flip the regime constantly. The Regime Flip Bars setting requires N consecutive bars on one side of the MA before the regime actually changes — default 3.
- Pick the threshold pair. Bull regime uses Bull Upper / Bull Lower (default 80 / 40). Bear regime uses Bear Upper / Bear Lower (default 60 / 20). Those values are plotted as the dynamic upper and lower lines on the RSI sub-panel — they jump at every regime change.
- Tint the bar background by regime. Optional. Each chart bar receives a soft fill (LightGreen or LightCoral by default, alpha controlled by Background Alpha) that makes the active regime visible at a glance without adding chart clutter.
- Expose everything as Series. RSI value, current upper/lower thresholds, regime (+1/-1), overbought/oversold flags, and crossover triggers are all available as public Series for strategies to consume directly.
🛠️ Using It in a Strategy
Every output of the indicator is exposed as a NinjaScript Series, so a strategy can ask the indicator directly what regime is active and whether RSI just triggered. No re-implementing the logic, no checking the value of a plot — pull the boolean cross flags and trade off them.
The skeleton below builds the indicator with default settings in State.DataLoaded, then in OnBarUpdate it filters entries by regime: take the bullish RSI cross signal only while in a bull regime, take the bearish cross only while in a bear regime. The available outputs are listed in the table beneath the example.
protected override void OnStateChange()
{
    if (State == State.SetDefaults)
    {
        Name = "RsiBrownDynamicLevelsExample";
    }
    else if (State == State.DataLoaded)
    {
        // 14-period RSI, 50-period EMA regime, hysteresis = 3 bars,
        // bull/bear thresholds at 80/40 and 60/20, white & dim regime tint.
        rsi = RsiBrownDynamicLevels(14, 50,
            RsiBrownDynamicLevels_MaType.EMA, 3,
            80, 40, 60, 20,
            true, true, 12,
            Brushes.LightGreen, Brushes.LightCoral);
    }
}

private RsiBrownDynamicLevels rsi;

protected override void OnBarUpdate()
{
    if (CurrentBar < 50) return;

    bool inBull = rsi.RegimeSeries[0] > 0;

    // Trade only with the regime: longs in bull when RSI crosses up out of oversold,
    // shorts in bear when RSI crosses down out of overbought.
    if (inBull && rsi.IsBullishCrossSeries[0])
    {
        EnterLong("RsiBullPullback");
    }
    else if (!inBull && rsi.IsBearishCrossSeries[0])
    {
        EnterShort("RsiBearRally");
    }
}
The full set of public Series outputs you can consume from a strategy:
Public Outputs
| Output | Type | Description |
|---|---|---|
| RsiSeries |
Series | The raw RSI value at each bar. |
| UpperLevelSeries |
Series | Active overbought threshold for the current regime (80 in bull, 60 in bear). |
| LowerLevelSeries |
Series | Active oversold threshold for the current regime (40 in bull, 20 in bear). |
| RegimeSeries |
Series | +1 when in a bull regime, -1 when in a bear regime. |
| IsOverboughtSeries |
Series | True when RSI > the active upper threshold for this bar. |
| IsOversoldSeries |
Series | True when RSI < the active lower threshold for this bar. |
| IsBullishCrossSeries |
Series | True the bar RSI crosses up through the active lower threshold — long-side trigger. |
| IsBearishCrossSeries |
Series | True the bar RSI crosses down through the active upper threshold — short-side trigger. |
📦 Download
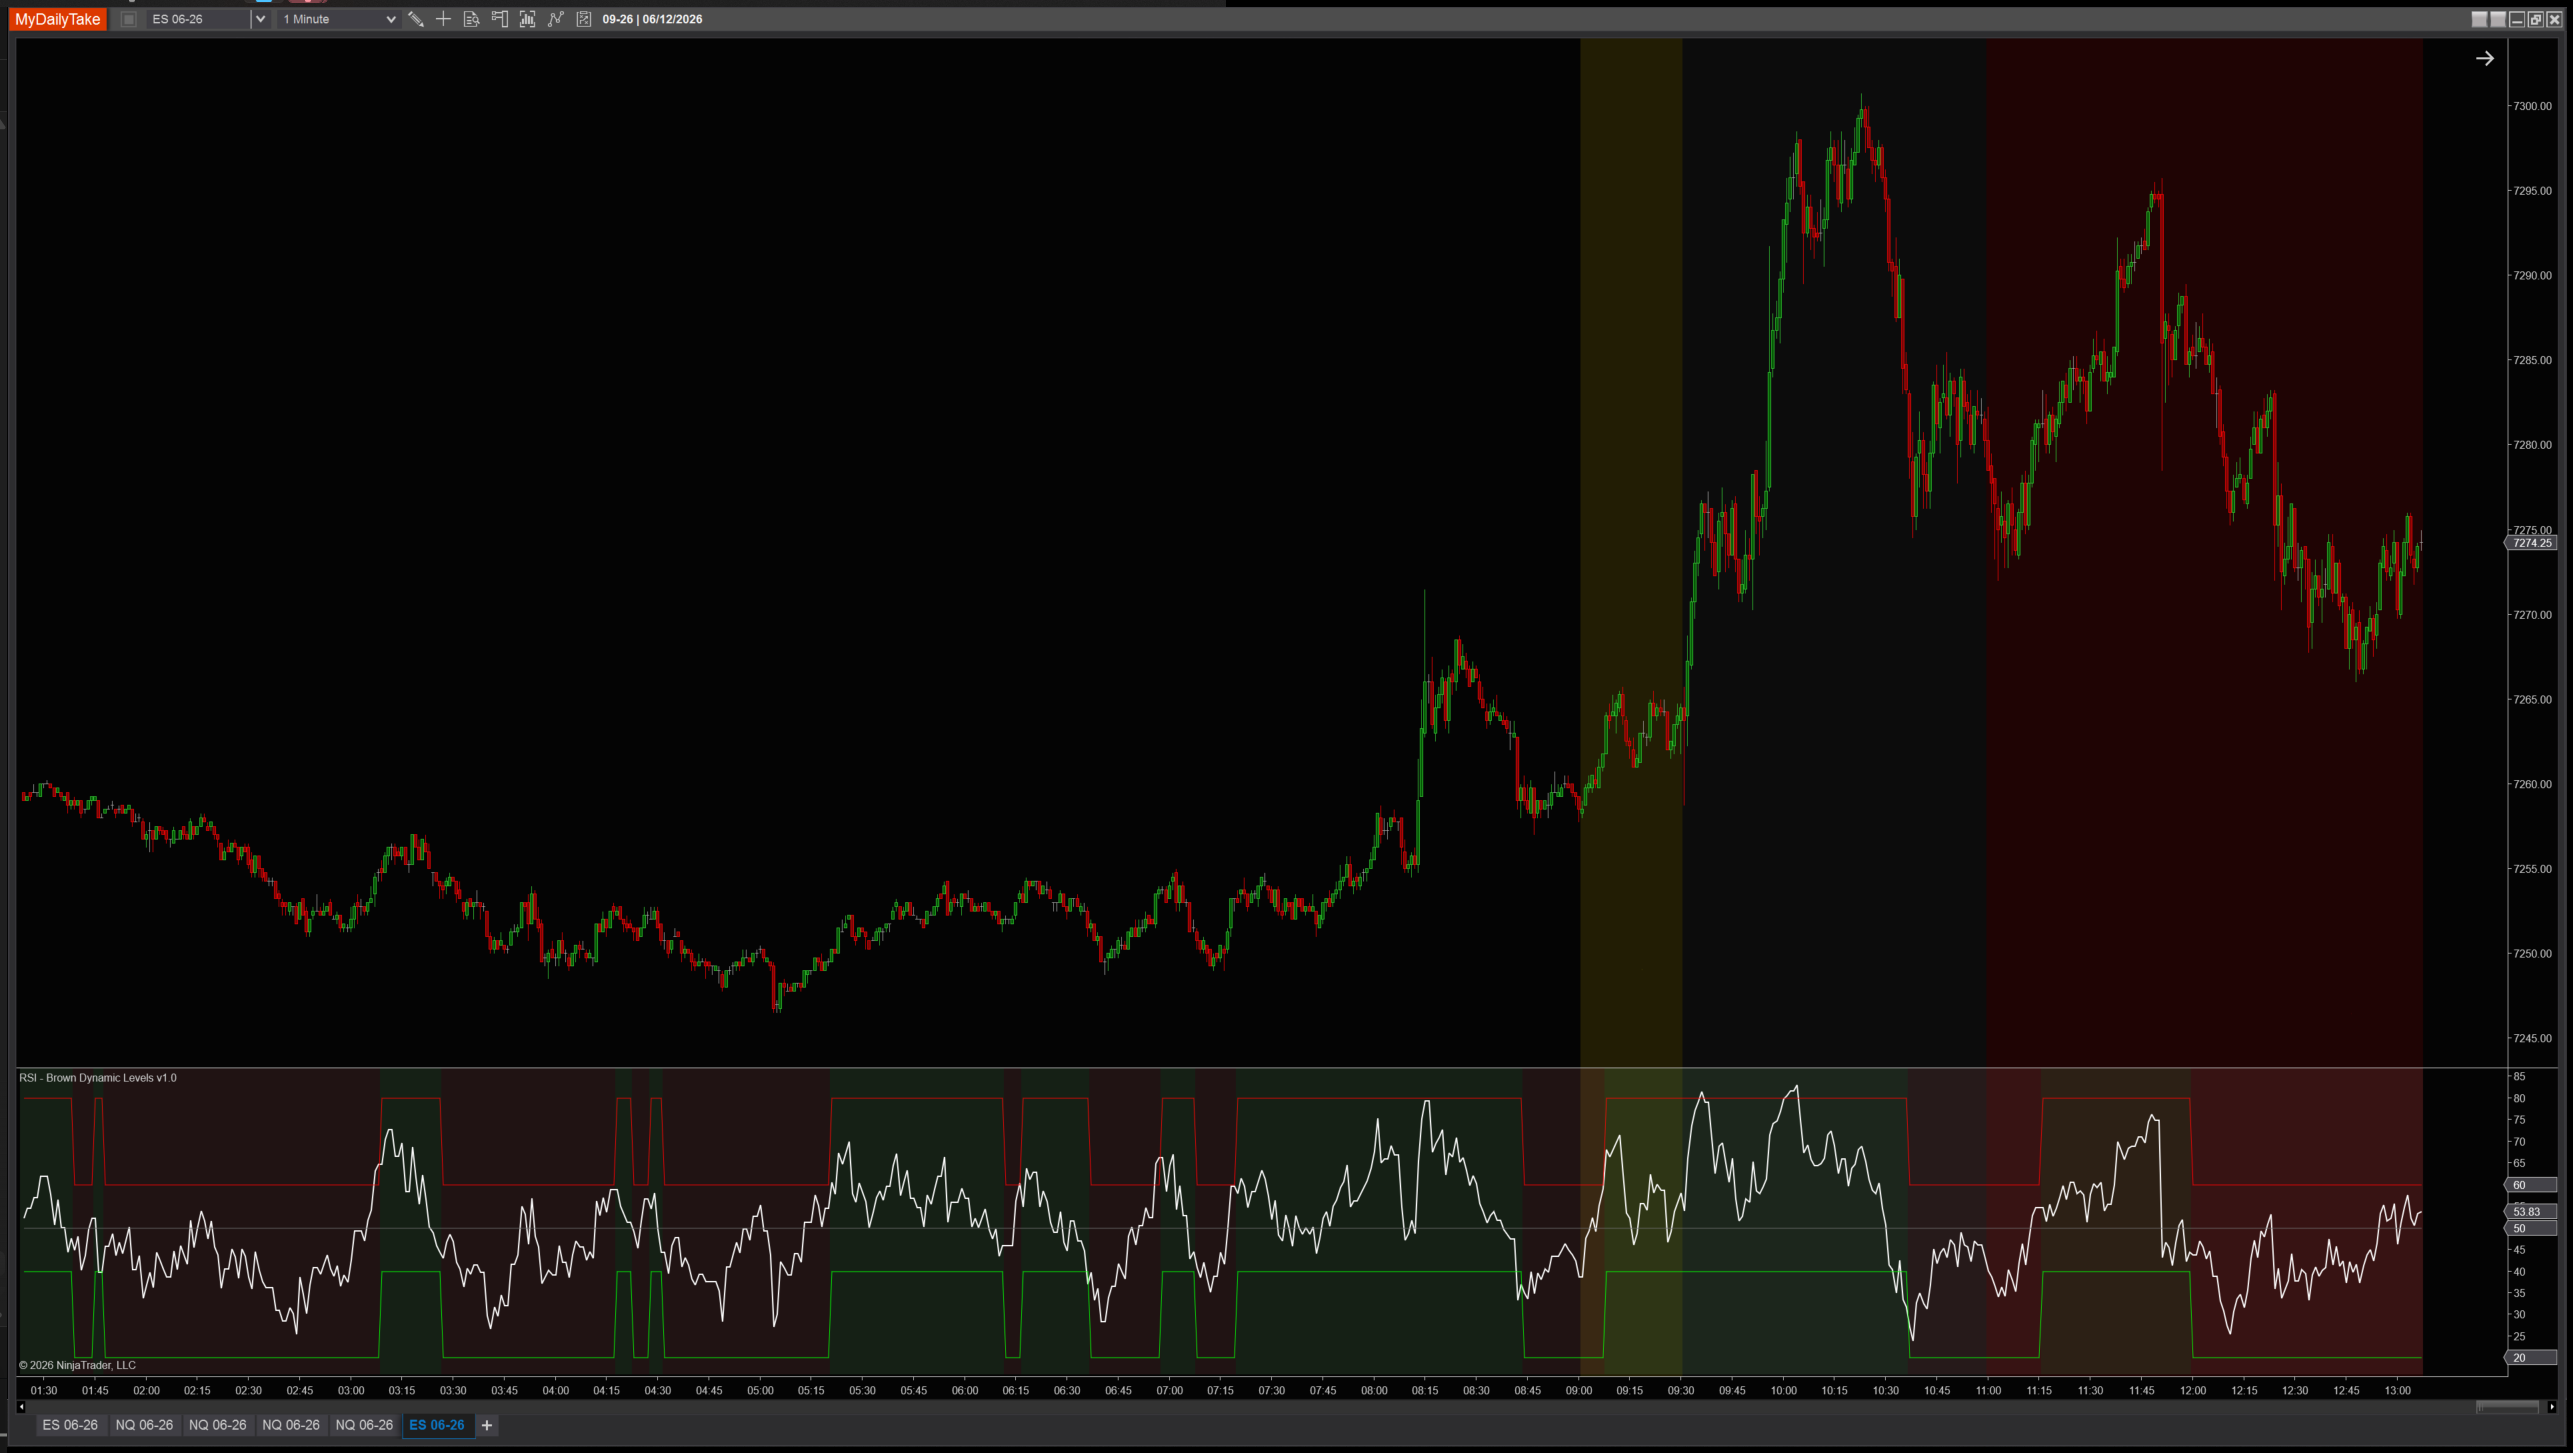
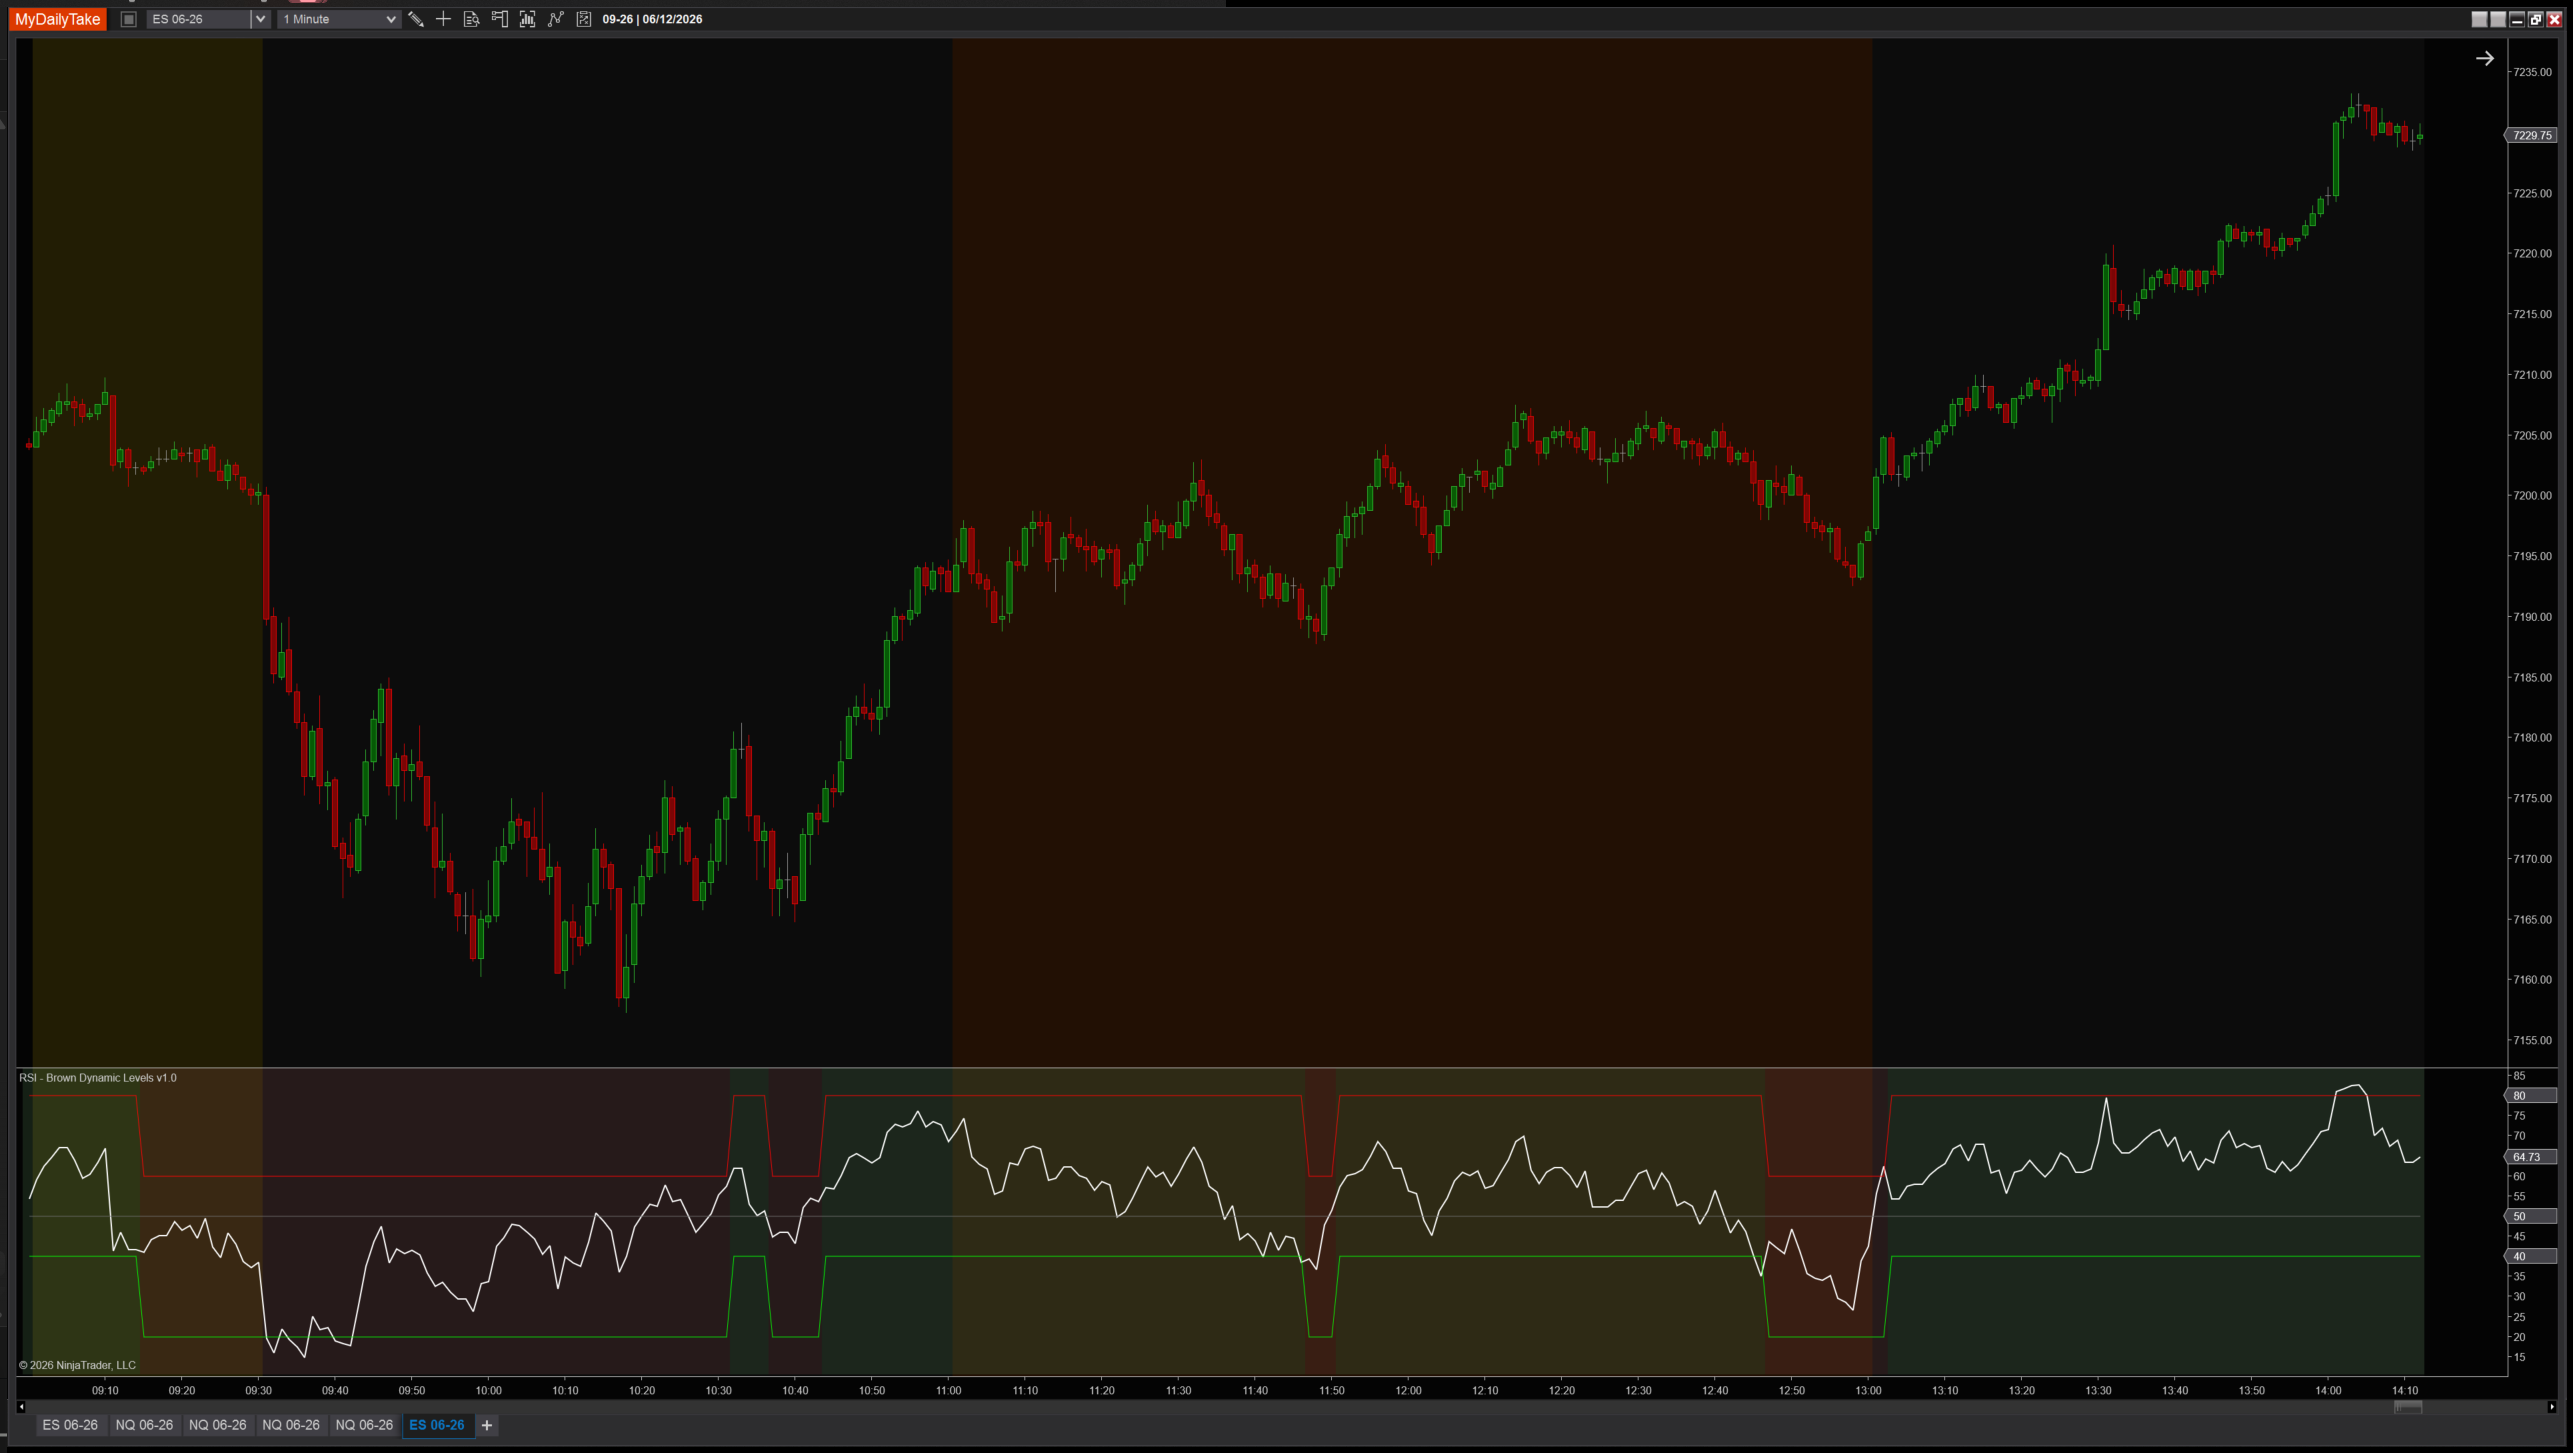
📊 Chart Examples
Two views of the indicator on NQ futures. The first shows a choppy session where the regime flips back and forth — notice how the dynamic threshold lines on the RSI sub-panel and the bar background tint both swap with each regime change. The second shows an extended bull-regime move where the higher 40/80 band is in effect through the entire run; the standard 30/70 thresholds would have generated repeated bad sell signals as RSI cycled in the 60–80 range.
🎉 Prop Trading Discounts
💥89% off at Bulenox.com with the code MDT89
This indicator is an original build for MyDailyTake.com inspired by Constance Brown’s Technical Analysis for the Trading Professional (1999, McGraw-Hill). Brown’s book is the canonical reference for the dynamic-threshold RSI concept; the methodology here follows the regime-aware threshold-pair approach she described, adapted to NinjaTrader 8. This implementation does not imply Brown’s endorsement.