TradingView HalfTrend [everget] Conversion to NinjaTrader 8
SuperTrend was a milestone for systematic trend trading — but its biggest weakness is whipsaw. Price wicks past the band by a tick, the trend flips, and you’re stopped out one bar before the real move resumes. HalfTrend by Alex Orekhov (TradingView’s everget) takes a different swing at the problem: instead of tracking the band that price most recently crossed, it uses a moving average of highs versus a stored running max-of-lows (and vice versa) to commit to a flip only when both the smoothed price and the structural pivot agree.
The result is a trend line that holds through more wick noise than SuperTrend, with translucent ATR channel ribbons above and below that visualize the volatility envelope around the active trend.
This post is the NinjaTrader 8 conversion. The full source compiles standalone in indTradingView/, exposes the trend state and flip signals as Series<> outputs, and is yours to download as a NinjaScript Archive.
Original Pine Script: HalfTrend by everget
License: GNU General Public License v3.0 (GPL-3.0)
🆚 What Makes HalfTrend Different from Standard SuperTrend
Standard SuperTrend (and most ATR-band trend tools) flips the moment price closes outside the active band. That’s binary, fast — and noisy. HalfTrend takes a more conservative path: it tracks two parallel signals and requires both to confirm before flipping.
SMA-vs-pivot confirmation. The flip from up to down requires the simple moving average of the high to fall below the running maximum-of-lows tracked since the last flip, AND the current close to fall below the prior bar’s low. Both conditions must be true simultaneously. The reverse pair gates the flip from down to up. This combination filters out the single-wick excursions that whipsaw SuperTrend.
Bracketed ATR channels. Above and below the active HalfTrend line sit two thin ATR-based channel lines — `Mult × ATR/2` away on each side. The space between the active line and the channels is filled translucently in the trend’s color, giving a clean visual envelope that shows where price is “inside” the trend versus stretching toward a possible flip.
Fewer flips, longer holds. On the same chart with the same instrument, HalfTrend typically produces a third to half as many flips as a SuperTrend with comparable settings. That means fewer entries — but the entries it does produce are higher conviction.
⚙️ Settings
HalfTrend exposes three property groups: the calculation inputs that drive the flip logic, the visual toggles that control arrows / channels / labels, and the color brushes for the buy and sell sides.
Calculation
| Parameter | Default | Description |
|---|---|---|
| Amplitude | 2 | Lookback for the SMA-of-High / SMA-of-Low and the pivot detection that drives flip decisions. |
| Channel Deviation | 2 | ATR multiplier applied to the channel-width offset above and below the HalfTrend line. |
| ATR Period | 100 | Period for the channel-width ATR. Pines hardcoded value is preserved as the default and exposed as a tunable here. |
Visuals
| Parameter | Default | Description |
|---|---|---|
| Show Arrows | True | Triangle markers at trend flips. |
| Show Channels | True | ATR upper/lower channel lines plus the translucent fills between them and the HalfTrend line. |
| Channel Fill Opacity | 15 | Opacity of the SharpDX channel fills (0–100). Lower = more translucent. |
| Show Buy/Sell Labels | True | Buy / Sell text labels at trend flips. |
| Label Font Size | 12 | Font size of the Buy/Sell labels. |
Display
| Parameter | Default | Description |
|---|---|---|
| Buy Color | Royal Blue | HalfTrend line, lower channel, and buy markers when the trend is up. |
| Sell Color | Red | HalfTrend line, upper channel, and sell markers when the trend is down. |
| Label Text Color | White | Text color of the Buy / Sell labels. |
🧠 How It Works
The core flip logic runs every confirmed bar and tracks two persistent state variables alongside the smoothed prices.
- Smoothed extremes. Compute
SMA(High, Amplitude)andSMA(Low, Amplitude)over the Amplitude lookback (default 2). These are the smoothed price references the flip logic compares against. - Pivot levels (running extremes). Track the running max-of-low and min-of-high over the Amplitude window. These are the structural levels the smoothed averages must clear to flip the trend.
- Down-flip condition. While in an uptrend, flip down when
SMA(High) < running_max_lowANDClose < prior_low. Both must hold on the same bar. - Up-flip condition. While in a downtrend, flip up when
SMA(Low) > running_min_highANDClose > prior_high. Same dual-confirmation pattern. - Active line + ATR channels. The HalfTrend line itself sits at the most recent flip’s pivot level. Two ATR-based channels —
line ± (ChannelDeviation × ATR/2)— bracket it on either side. A SharpDX trapezoid fill connects the active line to its same-side channel for the visual ribbon. - Signals on flip.
BuySignal[0]fires once on the bar that flips from down to up.SellSignal[0]fires on the opposite flip. Triangle markers and Buy / Sell text labels are drawn on the channel level at each flip.
The indicator is non-repainting: every flip decision is made on closed-bar data and never updates after the bar confirms.
🛠️ Using It in a Strategy
HalfTrend exposes its trend state, signals, and active levels as Series<> outputs. The most natural use in a strategy is to enter on BuySignal[0] / SellSignal[0] and trail your stop along the HalfTrendLine — the line itself is a usable stop level because it only moves in the trend’s favor.
Below is the full lifecycle: instantiate the indicator in State.DataLoaded, then react to flips and trail the stop along the HalfTrend line every bar. The public outputs are listed in a reference table after the code block.
private HalfTrend ht;

protected override void OnStateChange()
{
    if (State == State.SetDefaults)
    {
        Name = "HalfTrendStrategyExample";
    }
    else if (State == State.DataLoaded)
    {
        ht = HalfTrend(
            2,                       // Amplitude
            2,                       // Channel Deviation
            100,                     // ATR Period
            true,                    // Show Arrows
            true,                    // Show Channels
            15,                      // Channel Fill Opacity
            true,                    // Show Buy/Sell Labels
            12,                      // Label Font Size
            Brushes.RoyalBlue,       // Buy Color
            Brushes.Red,             // Sell Color
            Brushes.White            // Label Text Color
        );
    }
}

protected override void OnBarUpdate()
{
    if (CurrentBar < 100) return;

    if (ht.BuySignal[0])
    {
        // Trend just flipped up — enter long, set stop at the HalfTrend line
        EnterLong();
        SetStopLoss(CalculationMode.Price, ht.HalfTrendLine[0]);
    }

    if (ht.SellSignal[0])
    {
        // Trend just flipped down — enter short, set stop at the HalfTrend line
        EnterShort();
        SetStopLoss(CalculationMode.Price, ht.HalfTrendLine[0]);
    }

    // While in a trade, ratchet the stop to the active HalfTrend line every bar
    if (Position.MarketPosition == MarketPosition.Long)
        SetStopLoss(CalculationMode.Price, ht.HalfTrendLine[0]);
    else if (Position.MarketPosition == MarketPosition.Short)
        SetStopLoss(CalculationMode.Price, ht.HalfTrendLine[0]);
}
Every output is a Series<>, so you can index back in time freely — ht.TrendSeries[5] reads the trend state five bars ago, ht.AtrHigh[10] reads the upper channel level ten bars back. Each getter wraps Update() internally, no manual sync needed.
Public Outputs
| Output | Type | Description |
|---|---|---|
| HalfTrendLine[0] |
Series | The active HalfTrend line value — the support level when the trend is up, resistance when down. |
| AtrHigh[0] |
Series | Upper ATR channel level above the HalfTrend line. |
| AtrLow[0] |
Series | Lower ATR channel level below the HalfTrend line. |
| TrendSeries[0] |
Series | 0 when the trend is up, 1 when the trend is down. |
| BuySignal[0] |
Series | True on the bar where the trend flips from down to up. |
| SellSignal[0] |
Series | True on the bar where the trend flips from up to down. |
🔄 Conversion Notes
A few things changed in the translation from Pine Script to NinjaScript:
ATR Period exposed as a property. The Pine source uses ta.atr(100) as a hardcoded constant for the channel-width ATR. The NT8 conversion preserves 100 as the default but exposes it as the AtrPeriod property so traders can tune it for fast or slow markets without editing the script.
Channel circles → dots. Pine renders the upper / lower ATR channels with plot.style_circles. NT8 uses PlotStyle.Dot on two AddPlot calls — visually equivalent at common chart zoom levels.
Fill ribbons → SharpDX trapezoid geometry. Pine’s fill() between the HalfTrend line and each ATR channel becomes per-bar SharpDX path geometry in OnRender. Each pair of adjacent bars produces a four-point trapezoid filled with the trend-side translucent color, with opacity controlled by the ChannelOpacity property (0–100).
Buy / Sell labels via SharpDX. Pine’s plotshape with shape.labelup / shape.labeldown becomes SharpDX text rendering in OnRender. The LabelFontSize property (default 12) controls the rendered size, and the LabelTextColor brush controls the foreground.
Series-based public outputs. The trend state, both signals, the active line, and both channels are all exposed as Series<> for strategy consumption. Strategies can index back through history (ht.BuySignal[3] = was there a buy signal three bars ago?) and the Update() wrapper inside each getter ensures sync on every read.
Alerts stripped. The two alertcondition calls in the original Pine source are removed — strategy consumers read BuySignal and SellSignal directly via the public Series outputs.
📦 Download
The full source is available as a free NinjaScript Archive. To install:
- Download the
.zipfile below. - In NinjaTrader 8, go to Tools → Import → NinjaScript Add-On.
- Select the downloaded
.zipfile. - The indicator will appear under Indicators → indTradingView → HalfTrend [everget] on your chart.
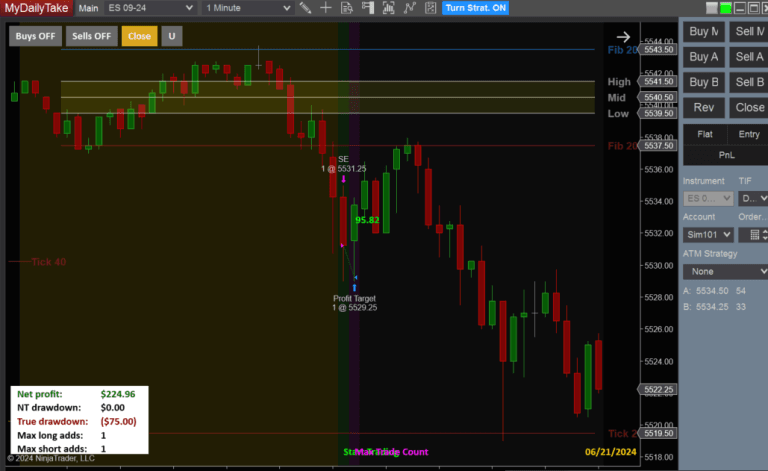
📊 Chart Example
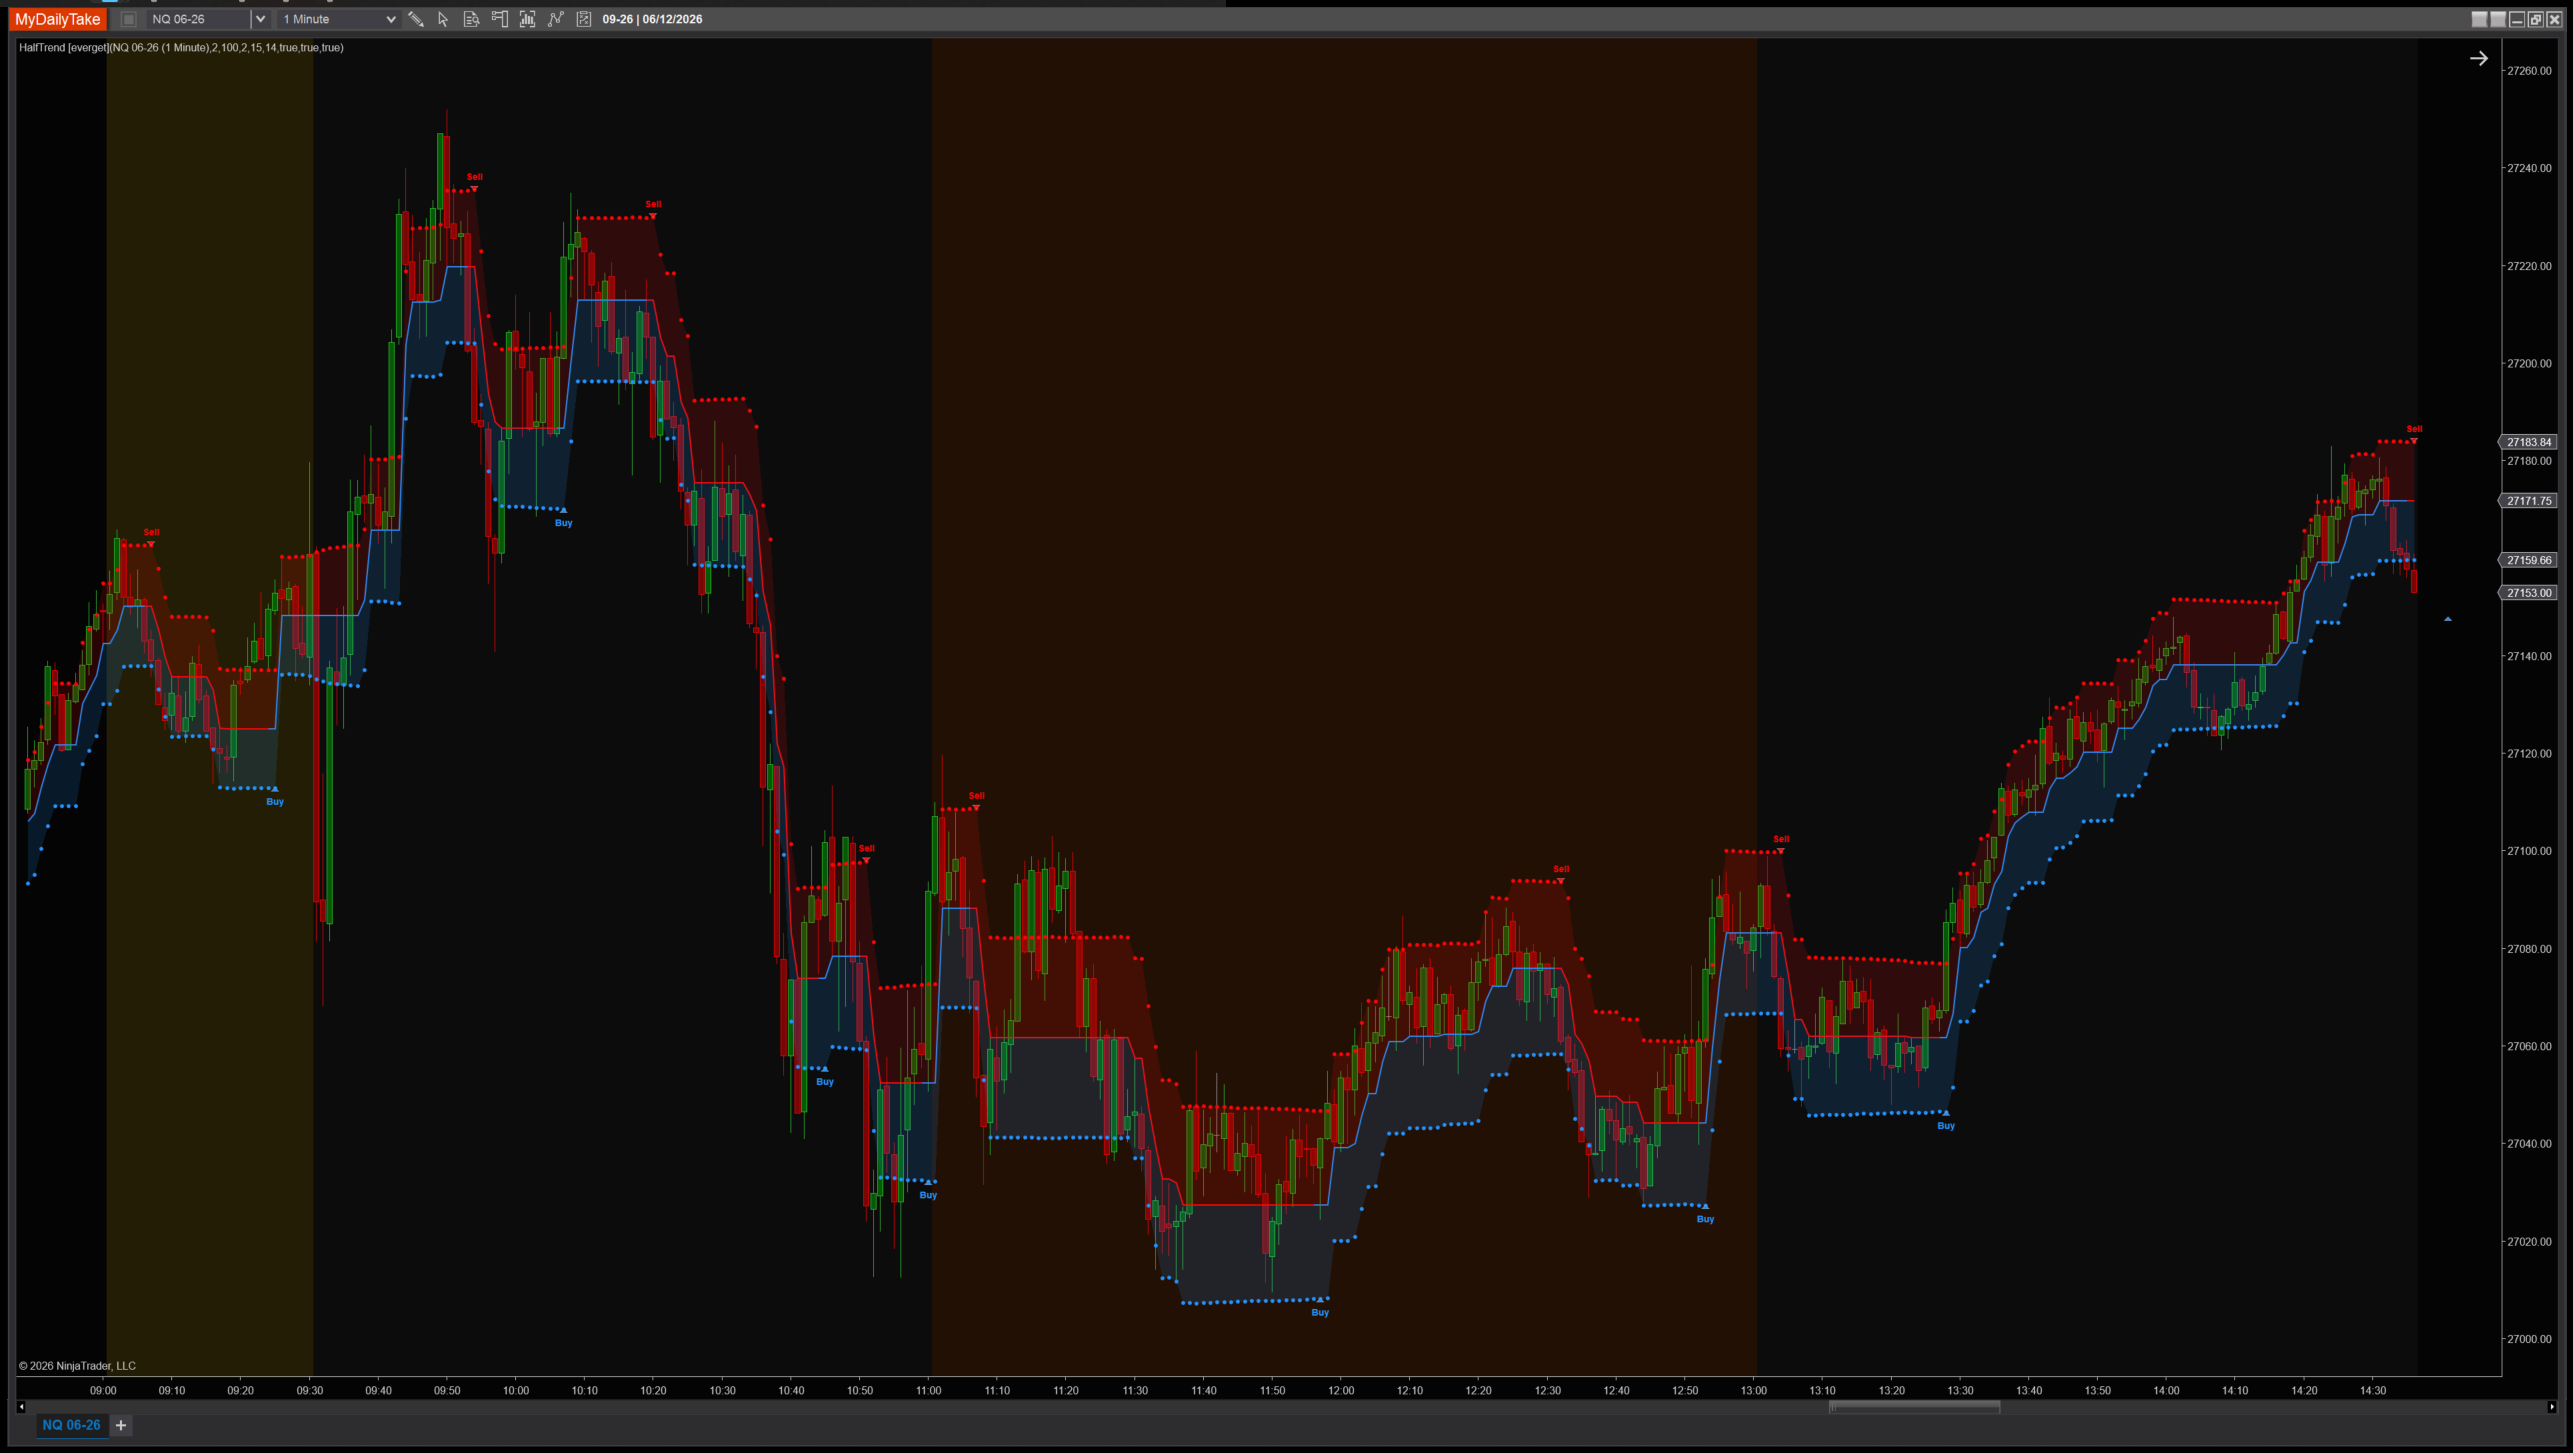
HalfTrend on a 1-minute chart with default settings (Amplitude 2, Channel Deviation 2, ATR Period 100). Notice how the line sits in plateaus rather than tracing every wick — that’s the SMA-vs-pivot confirmation gating flips. The blue translucent ribbon below the line visualizes the buy-side ATR envelope; the red ribbon does the same on the sell side after a flip. Triangle markers and Buy / Sell labels mark each confirmed flip on the channel level.
🎉 Prop Trading Discounts
💥89% off at Bulenox.com with the code MDT89
The original Pine Script™ code is by everget (Alex Orekhov) and is licensed under the GNU General Public License v3.0. This NinjaTrader 8 adaptation is by MyDailyTake.com. The use of evergets name or adapted code does not imply endorsement by the original author.