
TradingView Volume Divergence Reversal Signals [AlgoAlpha] Conversion to NinjaTrader 8
AlgoAlpha’s Volume Divergence Reversal Signals normalizes volume against the rolling 1000-bar peak to land in [0..100], then runs pivot-based divergence detection between volume and price. Bullish divergence = price prints a lower low while volume prints a higher high; bearish = price prints a higher high while volume prints a lower high.
Each detected divergence draws a connector line between the two pivots on both panels (price + the volume osc) plus a triangle marker on the price panel. Volume itself is rendered as a gradient column from purple (low) through yellow (high) — peripheral cue for volume regime.
This post is the NinjaTrader 8 conversion. The full source compiles standalone in indTradingView/, exposes the normalized volume + bull / bear divergence flags as Series<> outputs for strategy use, and is yours to download as a NinjaScript Archive.
Original Pine Script: Volume Divergence Reversal Signals by AlgoAlpha
License: Mozilla Public License 2.0 (MPL 2.0)
🆚 What Makes Volume Divergence Reversal Different
Standard volume divergence indicators take raw volume and OBV-style cumulative measures, then draw lines between pivots. The result varies wildly between assets — a ‘high volume’ bar on one ticker is nothing on another. AlgoAlpha’s normalization-by-peak approach lands volume in 0–100 universally — so the divergence detection works the same across markets.
Volume normalized to 0–100. volumeNormalized = volume / max(volume, 1000) × 100. The result is volume as a ‘percentile of recent peak.’ Comparable across assets and timeframes.
Pivot-based divergence with bar-gap window. Two pivots must satisfy RangeLower ≤ gap ≤ RangeUpper bars. Default 5 to 60. Pivots too close together or too far apart get filtered — the indicator looks for divergences in the canonical sweet spot.
Gradient column color. Volume bars are colored by a per-bar gradient — purple at low values, yellow at high. So extreme-volume bars stand out visually before any divergence detection kicks in.
Dual-panel divergence connectors. When a divergence fires, connector lines render on both the price panel and the volume osc panel. Same divergence, two synchronized views — easier to spot the geometric correspondence.
⚙️ Settings
Volume Divergence Reversal Signals exposes its inputs in two property groups: the Divergence (normalization length, pivot lookbacks, gap window, calculation toggle) and the Appearance bull / bear colors.
Divergence
| Parameter | Default | Description |
|---|---|---|
| Normalization Length | 1000 | Bars used for the rolling-peak normalization. |
| Calculate Divergence | True | Master toggle for divergence detection. |
| Pivot Lookback Left | 21 | Bars to the left required to confirm a pivot. |
| Pivot Lookback Right | 5 | Bars to the right required to confirm a pivot. |
| Max Bars Between Pivots (RangeUpper) | 60 | Maximum spacing between two pivots used in a divergence. |
| Min Bars Between Pivots (RangeLower) | 5 | Minimum spacing between two pivots. |
Appearance
| Parameter | Default | Description |
|---|---|---|
| Bullish Color | #00FFBB | Bullish divergence visuals (line + triangle + bar coloring). |
| Bearish Color | #FF1100 | Bearish divergence visuals. |
🧠 How It Works
Each bar runs the volume normalization, the pivot detection on the normalized volume, and the divergence check against price.
- Volume normalization. volumeNormalized = volume / MAX(volume, NormalizationLength) × 100. Output is in 0–100 — directly comparable across assets.
- Pivot detection on normalized volume. A pivot high is confirmed when bar [LookbackRight] is the highest in [bar − LookbackLeft − LookbackRight, bar]. Default windows: 21 left, 5 right.
- Anchor tracking. The most recent confirmed pivot’s volume value, price low, price high, and bar index are stored. Each new pivot compares against this anchor.
- Bull divergence. price low < anchor's price low AND volumeNormalized at pivot > anchor’s volume value AND RangeLower ≤ (current − anchor) bar gap ≤ RangeUpper. The bar gap window is the canonical divergence sweet spot.
- Bear divergence. price high > anchor’s price high AND volumeNormalized at pivot < anchor's volume value AND same gap window.
- Visuals. Connector lines on both panels via
Draw.Line+DrawOnPricePanel. Price-panel triangle markers viaDraw.TriangleUp/Draw.TriangleDown. Per-bar gradient column color via PlotBrushes. - Anchor update. After a pivot is processed (whether or not it produced a divergence), it becomes the new anchor.
The indicator is non-repainting — pivots are confirmed LookbackRight bars after the actual pivot bar, and divergence detection uses the closed-bar pivot stream.
🛠️ Using It in a Strategy
Volume Divergence Reversal Signals is built around two clean event signals. The most natural strategy use is to enter on confirmed divergence and exit when volume returns to a quiet zone (below a threshold) — the divergence has played out and there’s no more energy.
Below is the lifecycle: instantiate in State.DataLoaded, then in OnBarUpdate watch for divergence flags.
private VolumeDivergenceReversalSignals vdrs;

protected override void OnStateChange()
{
    if (State == State.SetDefaults)
    {
        Name = "VolumeDivergenceReversalStrategyExample";
    }
    else if (State == State.DataLoaded)
    {
        vdrs = VolumeDivergenceReversalSignals(
            1000,    // Normalization Length
            true,    // Calculate Divergence
            21,      // Pivot Lookback Left
            5,       // Pivot Lookback Right
            60,      // Range Upper
            5        // Range Lower
        );
    }
}

protected override void OnBarUpdate()
{
    if (CurrentBar < 1010) return;  // NormalizationLength warmup

    if (vdrs.BullDivergence[0] && Position.MarketPosition != MarketPosition.Long)
        EnterLong();
    if (vdrs.BearDivergence[0] && Position.MarketPosition != MarketPosition.Short)
        EnterShort();

    // Exit when volume returns to a quiet zone
    if (Position.MarketPosition != MarketPosition.Flat && vdrs.VolumeNormalized[0] < 30)
    {
        if (Position.MarketPosition == MarketPosition.Long)  ExitLong();
        if (Position.MarketPosition == MarketPosition.Short) ExitShort();
    }
}
All three outputs are Series<>. The strategy can read vdrs.VolumeNormalized[0] directly to gate further logic on volume regime.
Public Outputs
| Output | Type | Description |
|---|---|---|
| VolumeNormalized[0] |
Series | Volume scaled to 0–100 against the rolling NormalizationLength peak. |
| BullDivergence[0] |
Series | True on the bar a bullish divergence is confirmed. |
| BearDivergence[0] |
Series | True on the bar a bearish divergence is confirmed. |
🔄 Conversion Notes
A few things changed in the translation from Pine Script to NinjaScript:
NormalizationLength via NT8 MAX primitive. NT8’s MAX(Volume, NormalizationLength) handles the rolling-peak buffer sizing internally. Pine’s user-set normalization length can exceed 256 default lookback; NT8’s MAX sizes its own buffer.
Per-bar gradient column color. Pine’s color.from_gradient maps to a per-bar PlotBrushes assignment. The brush is computed by linearly interpolating between the bear color and the bull color at the bar’s normalized-volume value.
Dual-panel divergence connectors. Pine’s separate price-panel and osc-panel line.new calls become two Draw.Line calls with different DrawOnPricePanel values. Same divergence, two synchronized views.
Documented scope drop: Pine’s ta.requestVolumeDelta(...) for the lower-timeframe volume-delta poll, and the per-divergence Δ label, are dropped — the lower-timeframe poll is a TV-specific feature that would require an extra tick subscription in NT8. The base bar-level volume divergence detection is the headline feature.
Series-based public outputs. VolumeNormalized, BullDivergence, BearDivergence — covers the continuous metric and the event flags.
📦 Download
The full source is available as a free NinjaScript Archive. To install:
- Download the
.zipfile below. - In NinjaTrader 8, go to Tools → Import → NinjaScript Add-On.
- Select the downloaded
.zipfile. - The indicator will appear under Indicators → indTradingView → Volume Divergence Reversal Signals [AlgoAlpha] on your chart.
📊 Chart Example
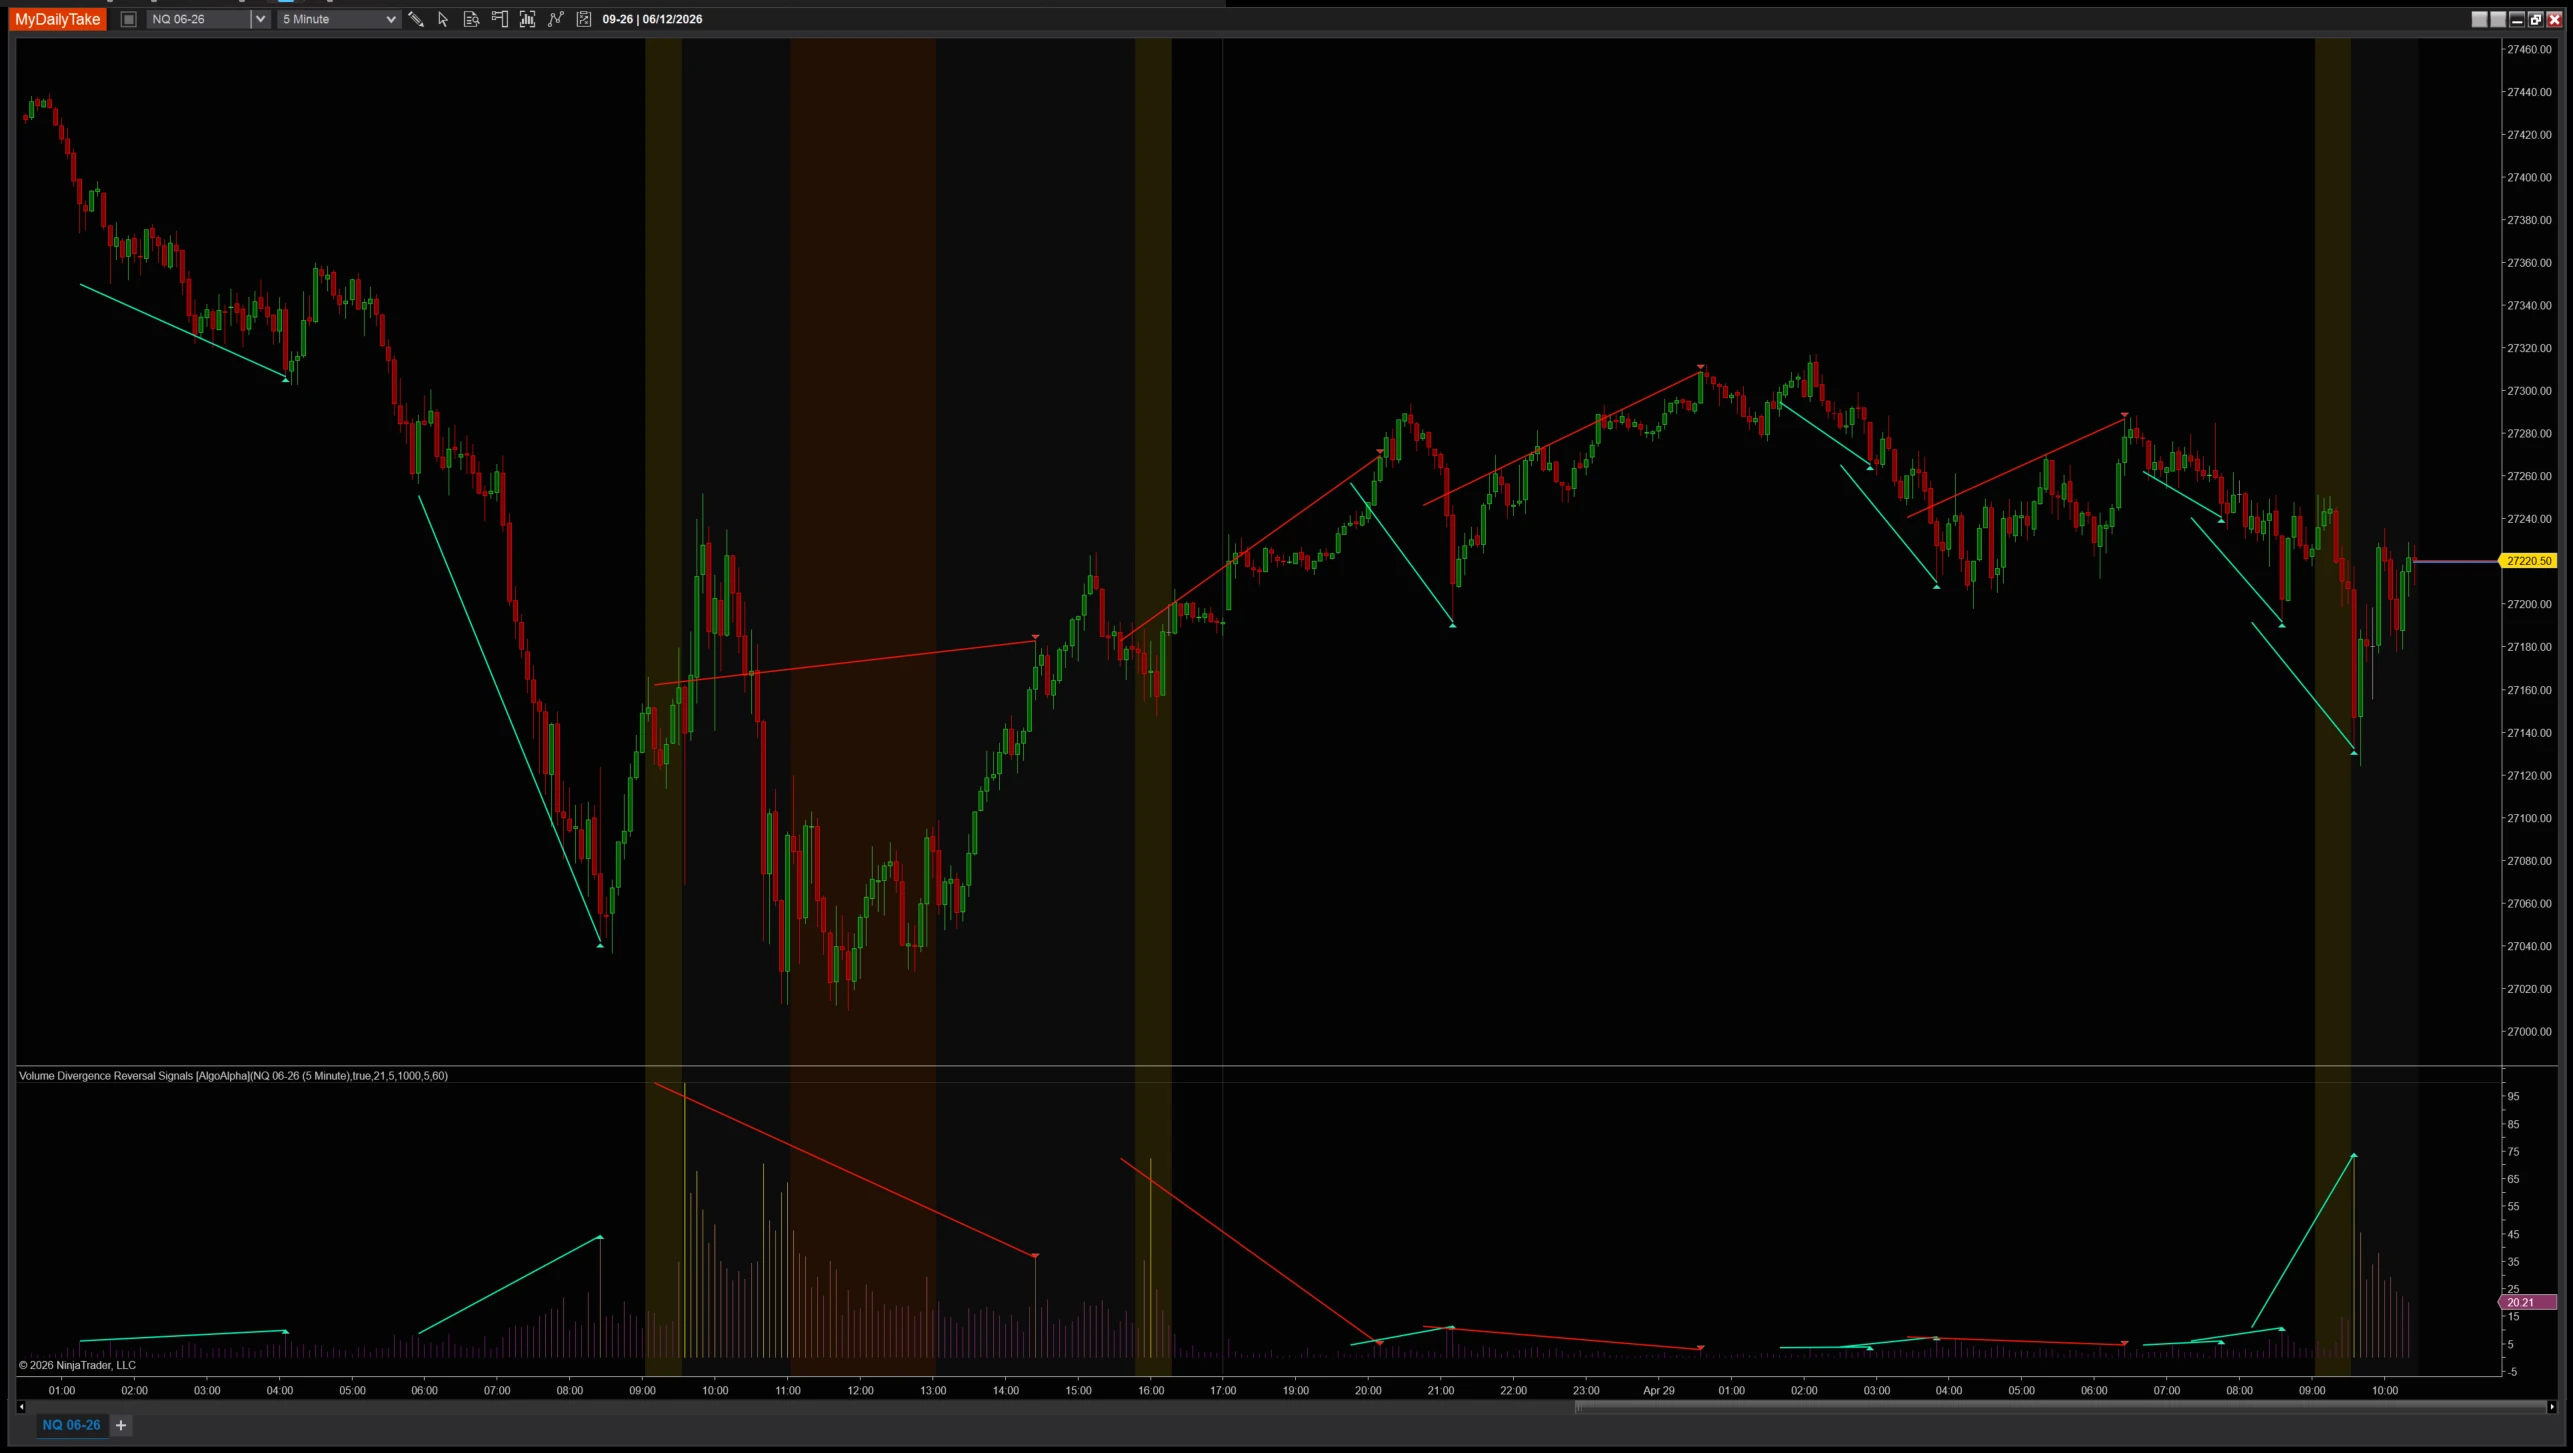
Volume Divergence Reversal Signals on a 1-minute chart with default settings (Norm=1000, Lookback 21/5, Range 5–60). The lower panel shows volume normalized to 0–100 with gradient column color from purple to yellow. Connector lines drop on both panels at confirmed divergences, with price-panel triangles marking the bar.


The original Pine Script™ code is by AlgoAlpha and is licensed under the Mozilla Public License 2.0 (MPL 2.0). This NinjaTrader 8 adaptation is by MyDailyTake.com. The use of AlgoAlpha’s name or adapted code does not imply endorsement by the original author.
