
TradingView Volume Whale Zones [ChartPrime] Conversion to NinjaTrader 8
ChartPrime’s Volume Whale Zones reads the highest-volume price zone — the POC of a 50-bin volume profile — and renders it as a ‘hot line’ on the chart, with smoothed transitions and a deviation HUD that tracks how far close is from the hot zone in ATR units.
The hot line uses a three-stage smoothing pipeline: stage 0 clamps the POC to ±2×ATR + EMA(10) so single-bar volume spikes don’t yank the line; stages 1 and 2 are snap-on-big-moves filters that let the line jump only when the POC has genuinely committed to a new level. The price range only expands (never contracts), locking the band extremes until a new high or low is taken.
This post is the NinjaTrader 8 conversion. The full source compiles standalone in indTradingView/, exposes the smoothed hot zone and the upper / lower zone bands as Series<double> outputs for strategy use, and is yours to download as a NinjaScript Archive.
Original Pine Script: Volume Whale Zones by ChartPrime
License: Mozilla Public License 2.0 (MPL 2.0)
🆚 What Makes Volume Whale Zones Different
Standard volume profile gives you a static POC line that jumps every time the highest-volume bin changes. Useful, but jittery — a single hot bar can briefly own the POC before the line snaps back. Volume Whale Zones smooths the POC through a three-stage filter so the displayed hot line is stable, but doesn’t lag against genuine regime changes.
Three-stage smoothing. Stage 0 clamps the raw POC to within ±2×ATR + EMA(10) — kills outlier spikes. Stages 1 and 2 are snap-on-big-moves filters: when the POC moves by more than a threshold from the current hot line, the hot line snaps to it; otherwise it holds. So small POC wobbles don’t move the line, but a real shift commits it.
Range-locking. The price range only expands. New highs widen the band; new lows widen the band; sideways movement doesn’t shrink it. So the band represents the actual range price has covered since the last regime, not just the current rolling high / low.
Square plot for stepline visual. NT8’s PlotStyle.Square at width 8 gives the same blocky stepline look as Pine’s distinctive volume profile rendering — the hot line reads as a thick block at each level, switching when the POC commits.
Deviation HUD. A 21-cell SharpDX oscillator HUD bottom-center shows close-vs-hot-zone in ATR units, clamped to ±4. Centered on zero with the cell at the current value highlighted. So you can see at a glance whether price is above, at, or below the hot zone, and by how many ATRs.
⚙️ Settings
Volume Whale Zones exposes its inputs in two property groups: the calculation parameters and the colors group with the hot-zone and recent-window colors.
Settings
| Parameter | Default | Description |
|---|---|---|
| Lookback | 200 | Most recent N bars used for the secondary 'Lookback' hot line overlay. |
| Show Hot Zone | True | Render the smoothed hot zone line. |
| Label Text Size | Small | Text size for HUD labels. |
Colors
| Parameter | Default | Description |
|---|---|---|
| Hot Zone Color | Red | Smoothed hot zone line + zone-band fills. |
| Lookback Color | #FF7B00 | Recent-window hot line overlay. |
🧠 How It Works
Each bar runs the 50-bin volume profile, the three-stage smoothing, and the band update.
- Range expansion. Update rangeHigh = max(rangeHigh, high), rangeLow = min(rangeLow, low). The range only grows; sideways movement doesn’t shrink it.
- 50-bin volume profile. Bin height = (rangeHigh − rangeLow) / 50. For each bar in the profile window, attribute its volume to the bin its close falls into. Highest-volume bin = raw POC.
- Stage 0 smoothing. Clamp rawPOC to within ±2 × ATR(200) of EMA(rawPOC, 10). Outlier spikes get clipped; ordinary POC variation passes through.
- Stages 1 and 2. Each stage is a snap-on-big-moves filter — if (newHotZone − currentHotZone) exceeds a threshold based on max(ATR(200), 500), the hot zone snaps to the new value; otherwise it holds. Two stages stack the filtering.
- Hot zone bands. HotZoneUp = rangeHigh − ATR thickness; HotZoneDn = rangeLow + ATR thickness. The bands constrain the hot zone’s drift to within the range without snapping it to the extremes.
- SharpDX gradient bands. Above and below the hot zone, the band’s gradient fades from solid HotZoneColor at the band edge to fully transparent at the hot line — visual peripheral cue for how far price is from the magnetic level.
- Deviation HUD. 21 cells centered on zero, each representing 0.4 ATR. The cell at the current (close − HotZone) / ATR ratio highlights, clamped to ±4 ATR. So the HUD always shows the active position in the same scale.
The indicator is non-repainting — POC binning, smoothing, and band updates all use closed-bar data only.
🛠️ Using It in a Strategy
Volume Whale Zones’ hot zone behaves like a magnet. The most natural strategy use is mean-reversion: when close is more than 2 ATRs from the hot zone, expect a return; when at the zone, expect chop. The example below buys when close is significantly below the hot zone and exits when it returns.
Below is the lifecycle: instantiate in State.DataLoaded, then in OnBarUpdate watch for distance from the hot zone.
private VolumeWhaleZones vwz;
private ATR atr200;

protected override void OnStateChange()
{
    if (State == State.SetDefaults)
    {
        Name = "VolumeWhaleZonesStrategyExample";
    }
    else if (State == State.DataLoaded)
    {
        vwz = VolumeWhaleZones(
            200,                                  // Lookback
            true,                                 // Show Hot Zone
            VolumeWhaleZones_TextSize.Small       // Label Text Size
        );
        atr200 = ATR(200);
    }
}

protected override void OnBarUpdate()
{
    if (CurrentBar < 220) return;

    double atr = atr200[0];
    if (atr == 0) return;

    double dev = (Close[0] - vwz.HotZone[0]) / atr;

    // Mean-reversion: enter when stretched 2+ ATRs from the hot zone
    if (dev < -2.0 && Position.MarketPosition != MarketPosition.Long)  EnterLong();
    if (dev >  2.0 && Position.MarketPosition != MarketPosition.Short) EnterShort();

    // Take profit when close returns to the hot zone
    if (Position.MarketPosition == MarketPosition.Long  && Close[0] >= vwz.HotZone[0]) ExitLong();
    if (Position.MarketPosition == MarketPosition.Short && Close[0] <= vwz.HotZone[0]) ExitShort();
}
All three outputs are Series<double>. vwz.HotZone[0] is the take-profit reference; vwz.HotZoneDn[0] / vwz.HotZoneUp[0] can serve as the stop levels.
Public Outputs
| Output | Type | Description |
|---|---|---|
| HotZone[0] |
Series | Smoothed hot zone (POC) value. Usable as a magnetic price level. |
| HotZoneUp[0] |
Series | Upper band of the hot-zone range. |
| HotZoneDn[0] |
Series | Lower band of the hot-zone range. |
🔄 Conversion Notes
A few things changed in the translation from Pine Script to NinjaScript:
50-bin volume profile via reusable buffer. A double[Rows] buffer is allocated once in DataLoaded so per-bar binning is just an array reset + fill. Highest bin’s center price = raw POC.
Three-stage smoothing as scalar fields. sHotZone0 / sHotZone1 / sHotZone2 are persistent Series<double> for each smoothing stage. Stages 1 and 2 use snap-on-big-moves logic with thresholds derived from max(ATR(200), 500).
Range-locking via persistent scalar fields. rangeHigh and rangeLow are NaN-seeded and update only on new highs / lows. Sideways movement leaves them alone — the range represents the cumulative price territory since the last reset.
PlotStyle.Square for stepline visual. Pine’s distinctive blocky volume-profile rendering is approximated by PlotStyle.Square at stroke width 8. Same visual character, no manual SharpDX needed.
SharpDX 21-cell deviation oscillator HUD. Pine’s oscillator overlay becomes a 21-cell HUD bottom-center, with the active cell highlighted by (close − HotZone) / ATR, clamped to ±4. Bottom-center anchor is calculated from ChartPanel dimensions per render.
Series-based public outputs. HotZone, HotZoneUp, HotZoneDn — strategies can read the smoothed POC directly without re-implementing the binning.
📦 Download
The full source is available as a free NinjaScript Archive. To install:
- Download the
.zipfile below. - In NinjaTrader 8, go to Tools → Import → NinjaScript Add-On.
- Select the downloaded
.zipfile. - The indicator will appear under Indicators → indTradingView → Volume Whale Zones [ChartPrime] on your chart.
📊 Chart Example
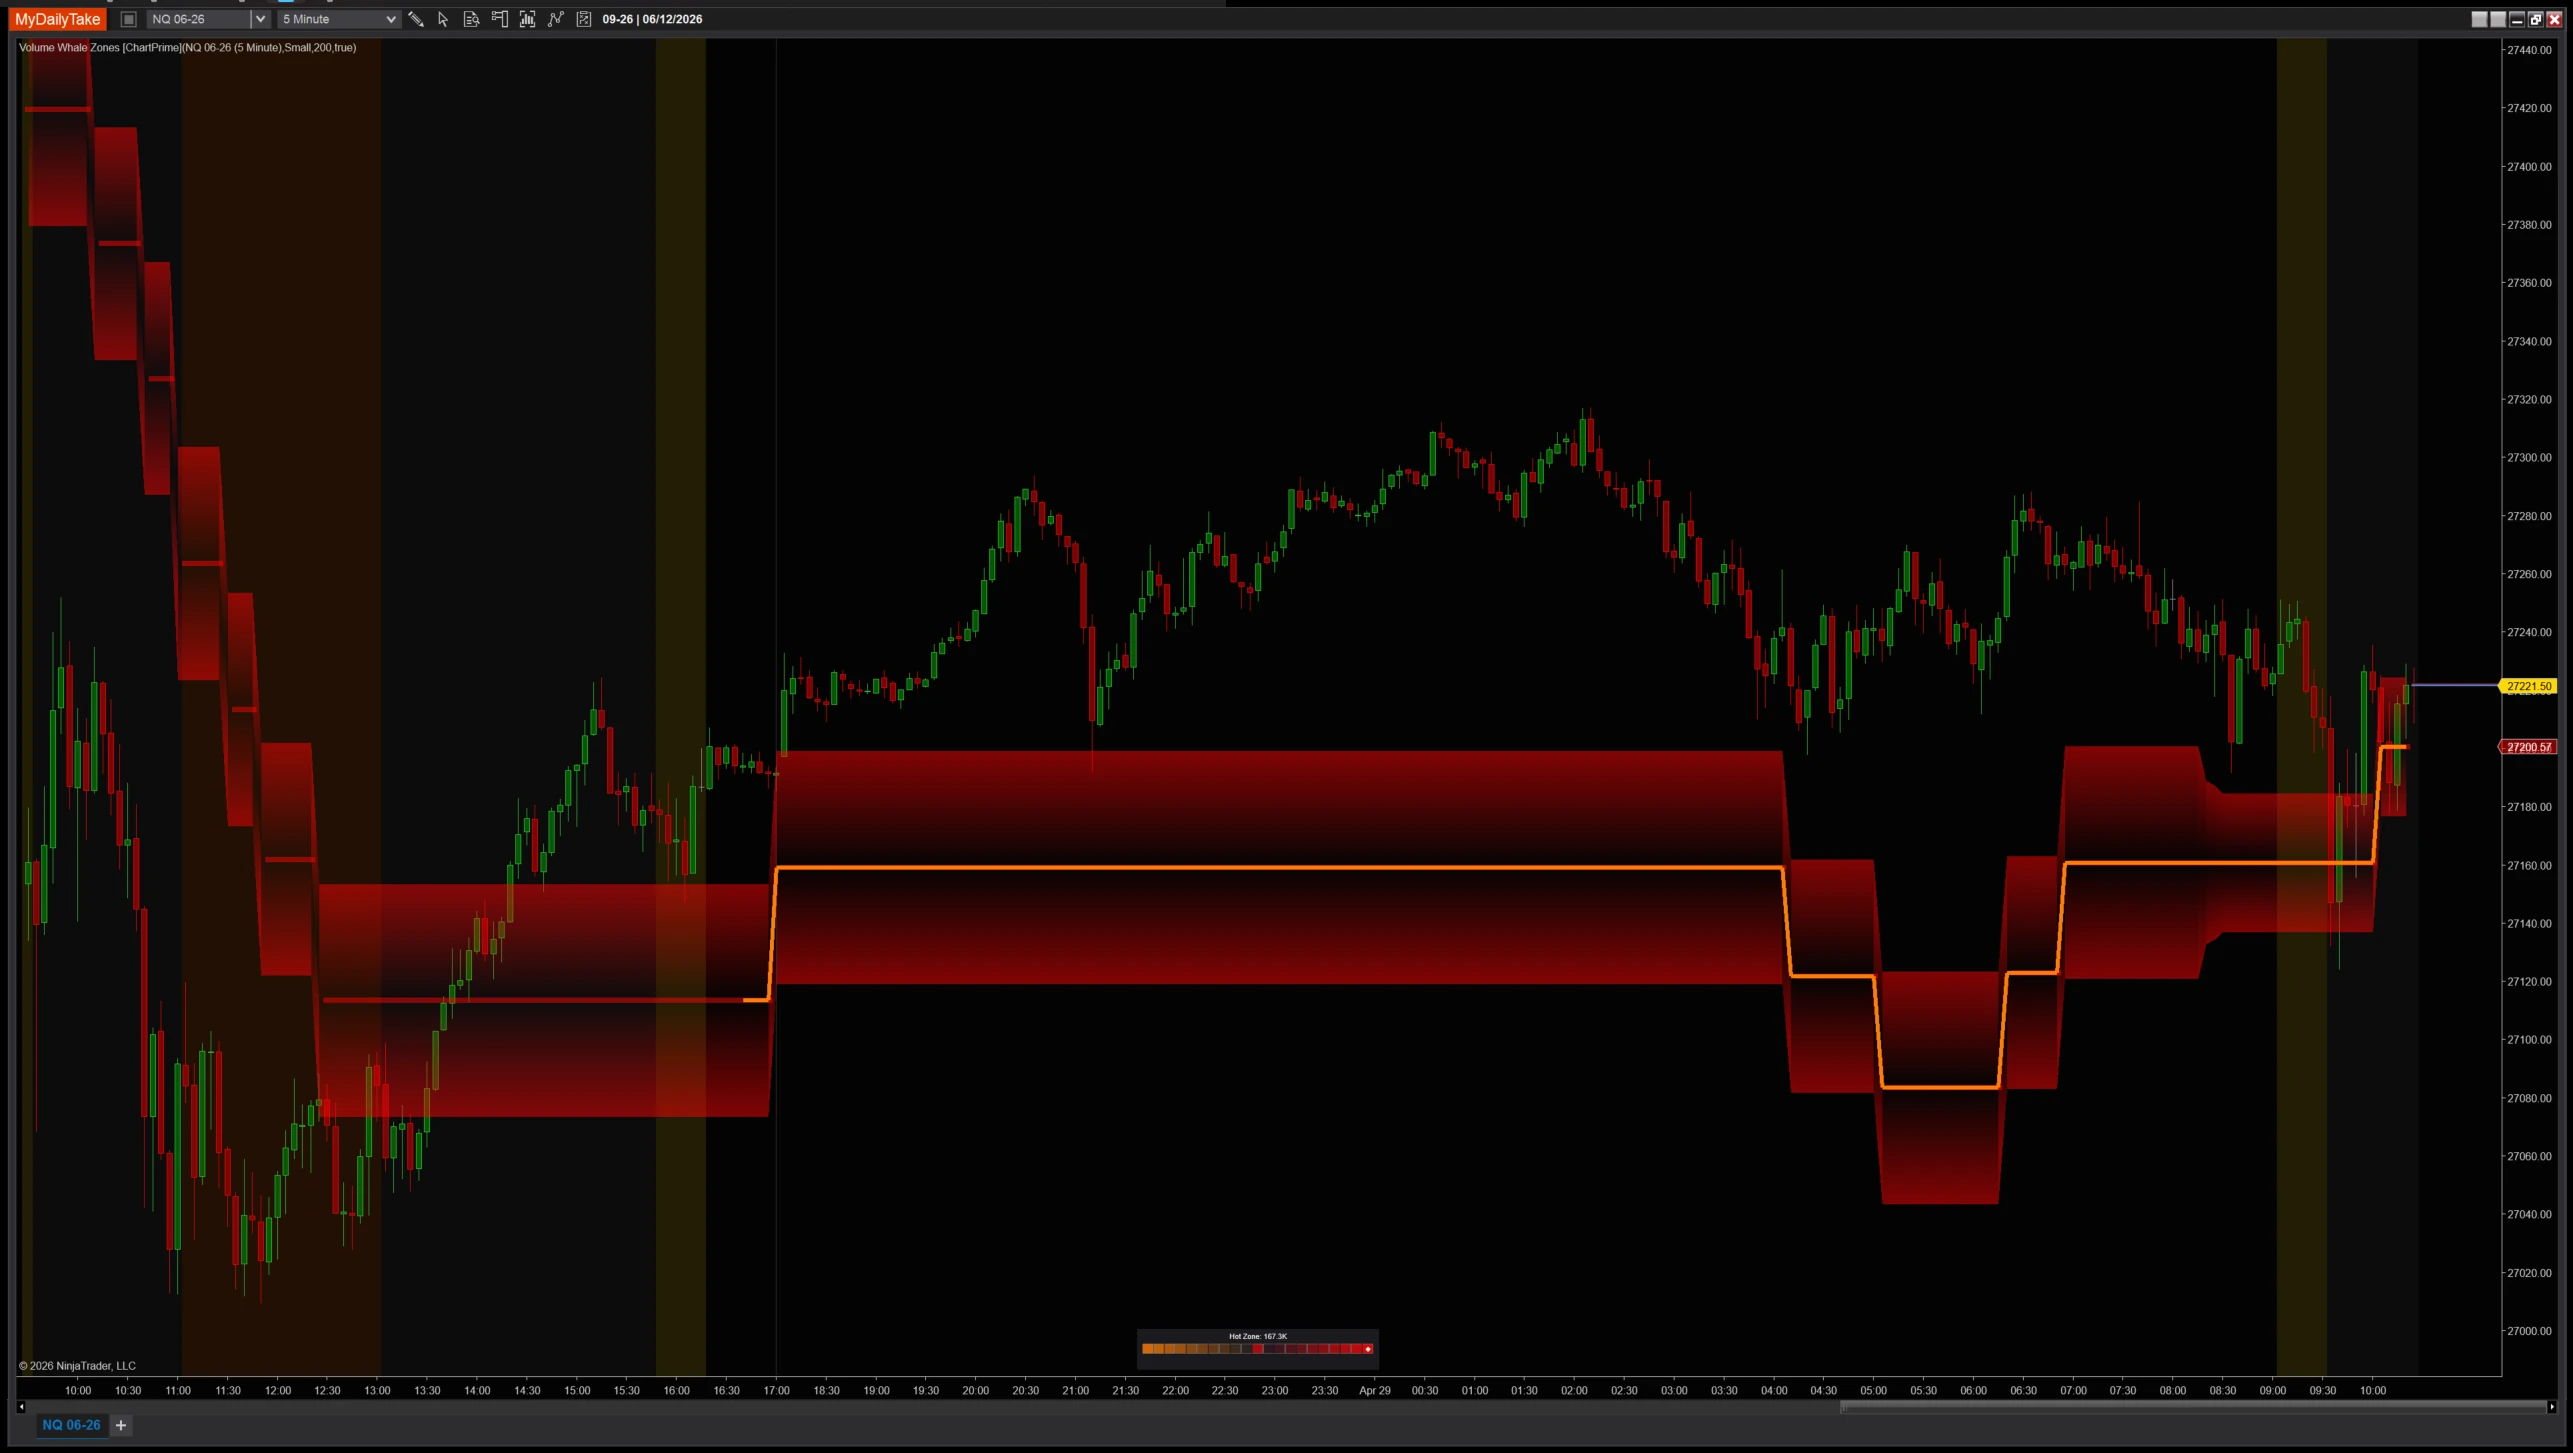
Volume Whale Zones on a 1-minute chart with default settings (Lookback=200). The thick hot zone line marks the smoothed POC; the secondary orange overlay marks the recent-window POC. Translucent bands fade from solid red at the range extremes to transparent at the hot zone — visual pull toward the magnet level. The bottom-center HUD shows close-vs-hot-zone in ATR units.


The original Pine Script™ code is by ChartPrime and is licensed under the Mozilla Public License 2.0 (MPL 2.0). This NinjaTrader 8 adaptation is by MyDailyTake.com. The use of ChartPrime’s name or adapted code does not imply endorsement by the original author.
