
TradingView Machine Learning: kNN (New Approach) [capissimo] Conversion to NinjaTrader 8
capissimo’s Machine Learning: kNN (New Approach) is a k-nearest-neighbors classifier dressed as a chart indicator. The ‘training set’ is recent history; the ‘query’ is the current bar’s projected feature vector; the ‘classification’ is whether the trend is up, down, or flat — fed back into a colored line on the price panel.
Default uses a 5-minute secondary timeframe for the kNN inputs, projects with HLCC4 source, K = 100 neighbors, N = 10 lookback. Three add-on filters (None, PivotPoint, ZScore) layer on additional gating logic. Three display modes (Curve, Predict, Both) toggle which visual elements render — a smoothed kNN curve, a forward-projected prediction marker 2 bars ahead of price, or both.
This post is the NinjaTrader 8 conversion. The full source compiles standalone in indTradingView/, exposes the kNN prediction value and the direction signal as Series<> outputs for strategy use, and is yours to download as a NinjaScript Archive.
Original Pine Script: Machine Learning: kNN (New Approach) by capissimo
License: Mozilla Public License 2.0 (MPL 2.0)
🆚 What Makes This kNN Different
Most ‘machine learning’ Pine indicators are fancy moving averages with ML branding. capissimo’s contribution is genuinely different — a custom kNN with a rolling minimum-distance check that’s actually classifying the current bar’s pattern against the K most-similar historical patterns.
Rolling-K minimum distance. For each bar, the indicator scans the last N×K historical bars, computes a distance metric to each (Euclidean on the projection-base feature), and keeps the K minimum-distance neighbors. The kNN prediction is a function of those neighbors’ subsequent bars — what happened next when the same pattern appeared before.
Secondary timeframe input. Default 5-minute. The kNN runs on the higher-TF data so the pattern matching isn’t whipsawing on every 1-min bar. The result is fed back to the chart timeframe via AddDataSeries.
Three add-on filters. None, PivotPoint, ZScore. PivotPoint gates the kNN signal on a pivot-pattern match; ZScore gates on the bar’s z-score (how stretched price is from its rolling mean). Each filter cuts down false positives.
Right-edge prediction marker. SharpDX renders a colored marker 2 bars forward of the live bar showing the current kNN’s predicted direction. Visual cue for ‘where does the model think we’re going next.’
⚙️ Settings
kNN exposes its inputs in five property groups: the higher-timeframe data series setup, the kNN parameters (N, K, projection base, prediction adjustment), the non-repaint toggle, the add-on filter selection, and the display mode.
Data Source
| Parameter | Default | Description |
|---|---|---|
| Resolution Type | Minute | Bars period type for the secondary timeframe. |
| Resolution Value | 5 | Period value (5 = 5-minute bars). |
| N (Lookback) | 10 | Lookback for each candidate pattern. |
| K (Neighbors) | 100 | Number of nearest-neighbor patterns retained per query. |
| Adjust Prediction | True | Apply a small per-bar correction to the prediction based on recent error. |
| Non Repainting | False | Use only closed bars from the secondary TF (slower; more conservative). |
Projection
| Parameter | Default | Description |
|---|---|---|
| Projection Base | HLCC4 | Source feature for the kNN distance — Close, HL2, HLC3, OHLC4, HLCC4. |
Add-On Filter
| Parameter | Default | Description |
|---|---|---|
| Add-On Filter | ZScore | Additional gate — None, PivotPoint, or ZScore. |
| Pivot Lag | 5 | Lookback for the pivot-point filter. |
| Z-Score Lag | 20 | Lookback for the z-score filter. |
Display
| Parameter | Default | Description |
|---|---|---|
| Show Mode | Both | Curve = kNN line only; Predict = forward marker only; Both = render both. |
🧠 How It Works
Each bar runs the kNN distance scan against the last N×K bars of the secondary TF, picks the K nearest, and projects forward.
- Secondary timeframe data.
AddDataSeries(BarsPeriodType, ResolutionValue)brings in the higher-TF bars. The kNN reads from this series for both training and query. - Projection feature. Per the ProjectionBase enum, compute the per-bar feature value (Close, HL2, HLC3, OHLC4, or HLCC4). This is the scalar fed into the distance calc.
- kNN distance scan. Walk the last N × K bars on the secondary TF. For each candidate, compute Euclidean distance between its N-bar feature window and the current bar’s window. Maintain the K minimum-distance neighbors via a priority-queue-like scan.
- Prediction. The K neighbors’ next-bar feature values are averaged → projected next-bar value. KnnPrediction[0] = that projection. AdjustPrediction applies a per-bar correction based on recent prediction error.
- Direction signal. 1 if KnnPrediction[0] > current price, −1 if below, 0 if within a small tolerance. Exposed as
Series<int>. - Add-on filter. If PivotPoint or ZScore filter is on, additional gating overrides Direction = 0 in cases where the filter says no.
- Visual layer. ShowMode = Curve renders the kNN prediction line. Predict renders a forward-projected marker 2 bars right of the live bar. Both renders both.
The indicator is non-repainting when NonRepainting = true (uses only closed bars from the secondary TF). With NonRepainting = false, the live bar’s HLCC4 contributes to the query — slightly faster signal, but the prediction can shift on the live bar.
🛠️ Using It in a Strategy
kNN’s most natural strategy use is the Direction flag — enter long when Direction crosses to +1, exit / reverse on −1, hold on 0. The example below trades direction flips and uses the kNN prediction value as a fade-toward-projection target.
Below is the lifecycle: instantiate in State.DataLoaded, then in OnBarUpdate watch for direction transitions.
private MachineLearningKnnNewApproach knn;

protected override void OnStateChange()
{
    if (State == State.SetDefaults)
    {
        Name = "KnnNewApproachStrategyExample";
    }
    else if (State == State.DataLoaded)
    {
        knn = MachineLearningKnnNewApproach(
            BarsPeriodType.Minute,
            5,                                                   // 5-min secondary TF
            10,                                                  // N (lookback)
            100,                                                 // K (neighbors)
            true,                                                // Adjust Prediction
            false,                                               // Non Repainting
            MachineLearningKnnNewApproach_Source.HLCC4,          // Projection Base
            MachineLearningKnnNewApproach_AddOn.ZScore,          // Add-On Filter
            5,                                                   // Pivot Lag
            20,                                                  // Z-Score Lag
            MachineLearningKnnNewApproach_Display.Both           // Show Mode
        );
    }
}

protected override void OnBarUpdate()
{
    if (BarsInProgress != 0) return;
    if (CurrentBars[0] < 100) return;

    bool flippedUp   = knn.Direction[0] ==  1 && knn.Direction[1] !=  1;
    bool flippedDown = knn.Direction[0] == -1 && knn.Direction[1] != -1;

    if (flippedUp   && Position.MarketPosition != MarketPosition.Long)  EnterLong();
    if (flippedDown && Position.MarketPosition != MarketPosition.Short) EnterShort();

    // Exit when the model goes neutral
    if (Position.MarketPosition != MarketPosition.Flat && knn.Direction[0] == 0)
    {
        if (Position.MarketPosition == MarketPosition.Long)  ExitLong();
        if (Position.MarketPosition == MarketPosition.Short) ExitShort();
    }
}
Both outputs are Series<>. The Direction signal handles the entry / exit logic; KnnPrediction can serve as a take-profit target if the strategy wants to fade toward the projection.
Public Outputs
| Output | Type | Description |
|---|---|---|
| KnnPrediction[0] |
Series | kNN-predicted price level (the curve). |
| Direction[0] |
Series | Predicted direction: 1 = up, −1 = down, 0 = flat. |
🔄 Conversion Notes
A few things changed in the translation from Pine Script to NinjaScript:
Secondary timeframe via AddDataSeries. Pine’s request.security on a higher TF maps to NT8’s AddDataSeries(BarsPeriodType, value) in State.Configure. The kNN reads BarsArray[1] for the higher-TF inputs.
kNN buffers reused per bar. Two double[] buffers (distBuf, neighborBuf) are allocated once and reused across bars — the per-bar cost is the scan and partial-sort, not the allocation.
Add-on filter as a typed enum. Pine’s string-input switch becomes MachineLearningKnnNewApproach_AddOn with None / PivotPoint / ZScore options. Each filter’s logic is inlined in OnBarUpdate.
Right-edge prediction marker via SharpDX. The forward-projected marker 2 bars right of the live bar is drawn directly in OnRender using cached up / dn / neutral brushes. No Draw.Dot needed; the position is computed from chartScale + chartControl.
Display mode via Plot.Reset. Curve mode hides the prediction marker; Predict mode hides the curve via Values[0].Reset(); Both renders everything.
Series-based public outputs. KnnPrediction + Direction — strategies fire off the integer Direction signal directly.
📦 Download
The full source is available as a free NinjaScript Archive. To install:
- Download the
.zipfile below. - In NinjaTrader 8, go to Tools → Import → NinjaScript Add-On.
- Select the downloaded
.zipfile. - The indicator will appear under Indicators → indTradingView → Machine Learning: kNN (New Approach) [capissimo] on your chart.
📊 Chart Example
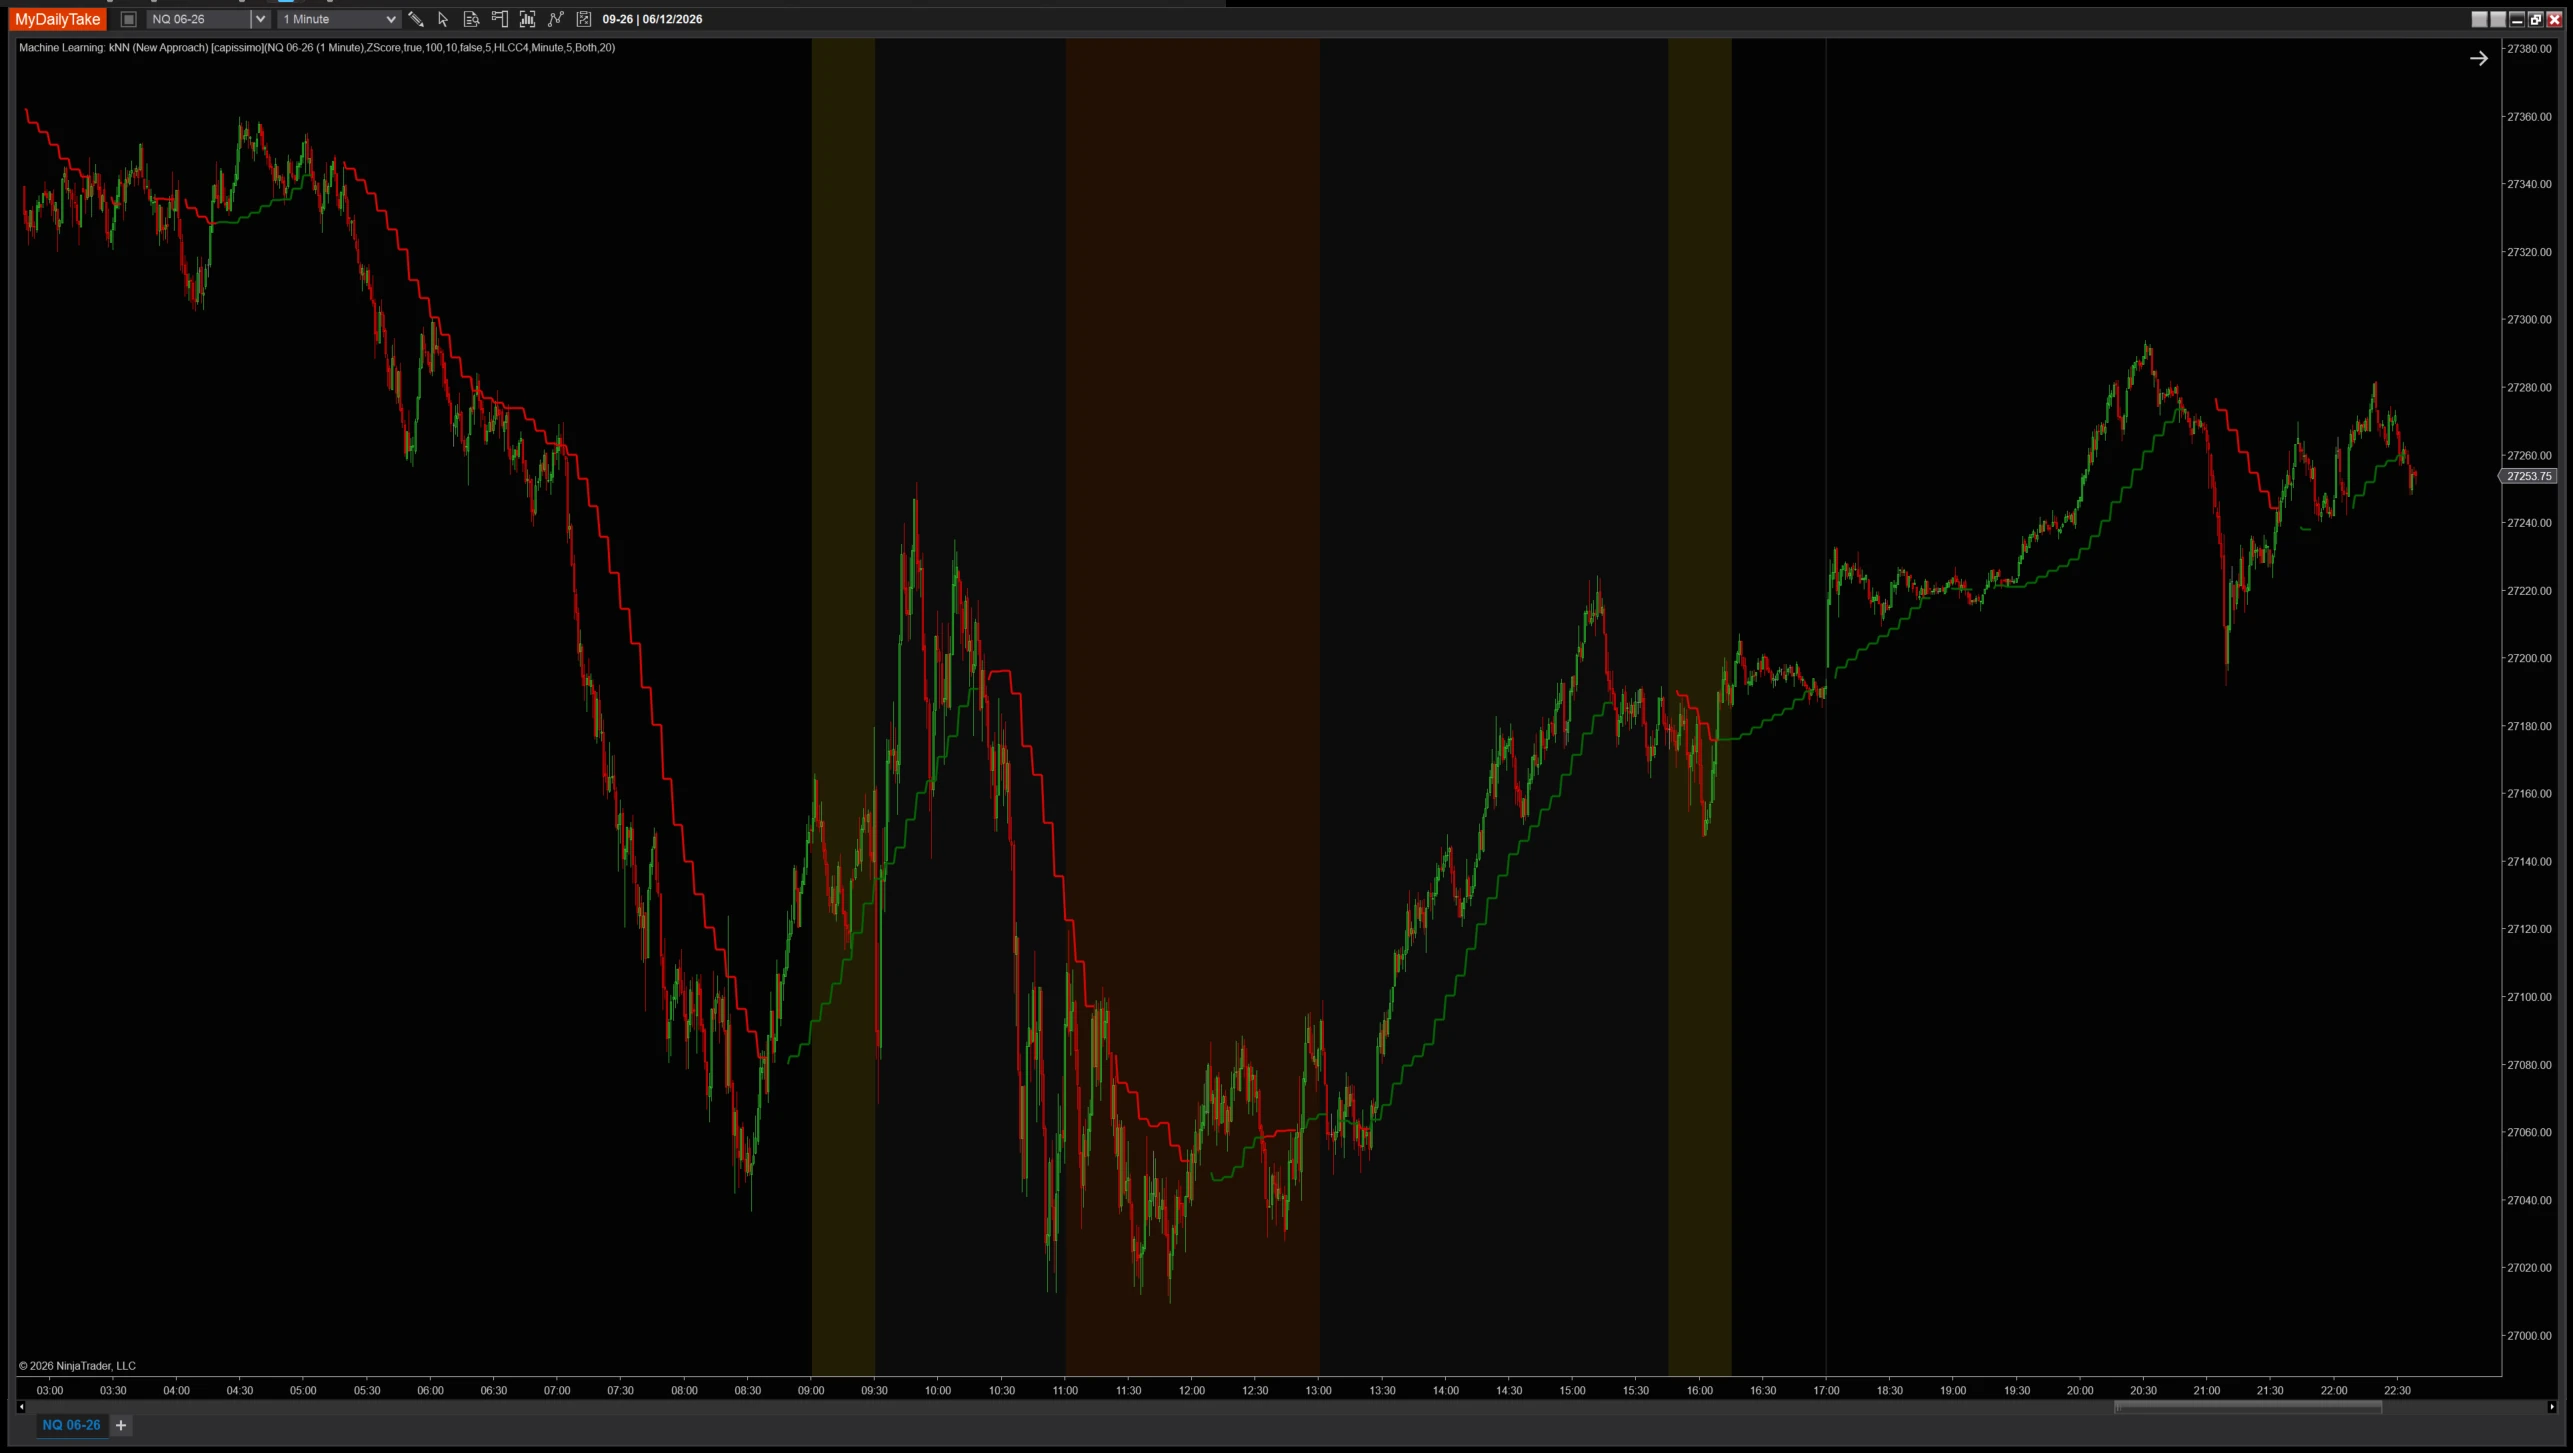
Machine Learning: kNN on a 1-minute chart with default settings (5-min secondary TF, K=100, N=10). The kNN-predicted curve glides through price; a colored marker 2 bars right of the live bar shows the predicted direction. ZScore filter gates out high-volatility false positives. Direction = +1 / −1 / 0 is exposed as a Series


The original Pine Script™ code is by capissimo and is licensed under the Mozilla Public License 2.0 (MPL 2.0). This NinjaTrader 8 adaptation is by MyDailyTake.com. The use of capissimo’s name or adapted code does not imply endorsement by the original author.
