TradingView Inertial Stochastic [LuxAlgo] Conversion to NinjaTrader 8
A standard stochastic uses a single fixed lookback. Pick a small one and the indicator twitches; pick a large one and it lags every turn. LuxAlgo’s Inertial Stochastic takes a different angle: scan all lengths from MinLen to MaxLen and pick the one whose stochastic value sits closest to the previous bar’s chosen value. The result is a stochastic that resists noise — it stays put unless a length confirms it has to move.
K is an SMA of the inertia-selected stochastic; D is an SMA of K. Visuals: K colored bull above 50 / bear below, D dotted, the canonical 80/20 reference lines, and a vertical gradient fill from the K line to the 50 midline — bull-tinted above, bear-tinted below.
This post is the NinjaTrader 8 conversion. The full source compiles standalone in indTradingView/, exposes K, D, and the raw inertia-selected stochastic as Series<double> outputs for strategy use, and is yours to download as a NinjaScript Archive.
Original Pine Script: Inertial Stochastic by LuxAlgo
License: Attribution-NonCommercial-ShareAlike 4.0 International (CC BY-NC-SA 4.0)
🆚 What Makes Inertial Stochastic Different
Standard stochastic on a 14-bar window oscillates on noise: any small swing inside the window can move the indicator even if the trend hasn’t changed. Single-length stochastic optimizers chase a perfect period and end up overfit. LuxAlgo’s contribution is to skip the optimization problem and lean on inertia instead.
Inertia scan. Each closed bar, the indicator runs every length from MinLen to MaxLen on the current bar’s price, then selects the length whose stochastic value lies closest to the previous bar’s chosen value (called LV — Last Visited). If five different lengths each produce a similar value, the indicator’s reading barely moves. If only one length produces a value near LV, the indicator commits to that length’s reading — but the move is data-driven, not arbitrary.
Resists noise without lag. The classic noise/lag tradeoff doesn’t apply here in the same way. A noisy bar hardly moves the indicator if any candidate length produces an LV-near value. A genuine trend change pushes the indicator because no candidate length can keep LV-near anymore — every length is producing a different reading.
⚙️ Settings
Inertial Stochastic exposes its inputs in two property groups: the calculation parameters (length-scan range and the K/D smoothing periods), and the style group with the bull / bear colors that drive the K line and gradient fills.
Settings
| Parameter | Default | Description |
|---|---|---|
| Minimum Length | 10 | Smallest stochastic length the inertia scan considers each bar. |
| Maximum Length | 40 | Largest stochastic length the inertia scan considers each bar. |
| K Smoothing | 3 | SMA length applied to the inertia stochastic to produce K. |
| D Smoothing | 3 | SMA length applied to K to produce D. |
Style
| Parameter | Default | Description |
|---|---|---|
| Bullish Color | #089981 | K line color and gradient fill above 50. |
| Bearish Color | #F23645 | K line color and gradient fill below 50. |
🧠 How It Works
Each bar runs the multi-length stochastic scan, picks the inertia-best result, then smooths it into K and D.
- Multi-length stochastic scan. Walk lengths from MinLen to MaxLen. For each length, compute %K = 100 × (Close − Lowest) / (Highest − Lowest) over that window. The implementation maintains running highest/lowest to amortize the inner loop — O(MaxLen) per bar, not O(MaxLen²).
- Inertia selection. Of all candidate %K values, pick the one whose absolute distance from the previous bar’s LV is smallest. That length’s stochastic becomes the new LV. The intuition: if any candidate lookback agrees with where the indicator was, trust the inertia and don’t move; only commit to a move when no length can.
- K smoothing. K = SMA(LV, K Smoothing). Default 3. Smooths out single-bar inertia jumps without reducing the indicator’s responsiveness to a sustained move.
- D smoothing. D = SMA(K, D Smoothing). Default 3. The signal line. K crossing D reads as the standard stochastic crossover.
- Color flow + gradient fill. K is colored bull above 50 and bear below 50, with the per-bar PlotBrushes assignment. SharpDX vertical gradient fills the area between K and the 50 midline — bull-tinted when K > 50, bear-tinted when K < 50. The 80 / 20 reference lines use the standard overbought / oversold marks.
The indicator is non-repainting. The inertia scan reads only High / Low / Close from the closed bar and back, and LV is updated once per bar.
🛠️ Using It in a Strategy
Inertial Stochastic’s most natural strategy use is the same as a standard stochastic — K crosses D for entries, but with the noise-resistant LV input meaning fewer false crossings. The example below uses a midline-crossing strategy: enter long when K crosses up through 50 and the cross has D-confirmation; enter short on the symmetric case.
Below is the lifecycle: instantiate in State.DataLoaded, then in OnBarUpdate watch for the K/midline crossings.
private InertialStochastic istoc;

protected override void OnStateChange()
{
    if (State == State.SetDefaults)
    {
        Name = "InertialStochasticStrategyExample";
    }
    else if (State == State.DataLoaded)
    {
        istoc = InertialStochastic(
            10,    // Minimum Length
            40,    // Maximum Length
            3,     // K Smoothing
            3      // D Smoothing
        );
    }
}

protected override void OnBarUpdate()
{
    if (CurrentBar < 60) return;

    double k0 = istoc.KLine[0];
    double k1 = istoc.KLine[1];
    double d0 = istoc.DLine[0];

    // Midline cross with D confirming the direction
    bool crossUp50   = k0 > 50.0 && k1 <= 50.0 && k0 > d0;
    bool crossDown50 = k0 < 50.0 && k1 >= 50.0 && k0 < d0;

    if (crossUp50)   EnterLong();
    if (crossDown50) EnterShort();

    // Exit when stochastic returns to the opposite zone (overbought / oversold)
    if (Position.MarketPosition == MarketPosition.Long  && k0 > 80.0) ExitLong();
    if (Position.MarketPosition == MarketPosition.Short && k0 < 20.0) ExitShort();
}
All three outputs are Series<>. Reading istoc.LvStoch[0] directly gives you the raw inertia-selected value before K smoothing — useful if you want to build your own smoothing on top.
Public Outputs
| Output | Type | Description |
|---|---|---|
| KLine[0] |
Series | K = SMA(LV, K Smoothing). Primary line, bull/bear colored above/below 50. |
| DLine[0] |
Series | D = SMA(K, D Smoothing). Dotted signal line. |
| LvStoch[0] |
Series | Raw inertia-selected stochastic before K smoothing. The Last Visited value. |
🔄 Conversion Notes
A few things changed in the translation from Pine Script to NinjaScript:
Inertia scan amortized. A naive implementation reaccumulates Highest / Lowest from scratch for every candidate length — O(MaxLen²) per bar. The conversion maintains running max / min as the loop expands, so the inner cost is O(MaxLen). Identical output, well-behaved on tick or 1-minute bars.
Canonical SharpDX vertical gradient brush. This indicator is the template for the multi-script SharpDX LinearGradientBrush pattern. The GradientStopCollection is built once in OnRenderTargetChanged and rebuilt only on color change; the brush itself is rebuilt per render frame because the Y coordinates depend on the live chartScale.
K color flow via PlotBrushes. Pine’s color expression on the K plot becomes a per-bar PlotBrushes[0][0] assignment in OnBarUpdate — bull when K > 50, bear when K < 50.
Reference lines as horizontal hlines. Pine’s hline() calls become AddLine in SetDefaults with a translucent gray brush. Standard 80 / 20 marks plus an implicit 50 from the gradient anchor.
Series-based public outputs. KLine, DLine, and LvStoch are all exposed as Series<double> for strategy consumption. The raw LV stoch is the headline — strategies that want to apply their own smoothing can read it directly.
📦 Download
The full source is available as a free NinjaScript Archive. To install:
- Download the
.zipfile below. - In NinjaTrader 8, go to Tools → Import → NinjaScript Add-On.
- Select the downloaded
.zipfile. - The indicator will appear under Indicators → indTradingView → Inertial Stochastic [LuxAlgo] on your chart.
📊 Chart Example
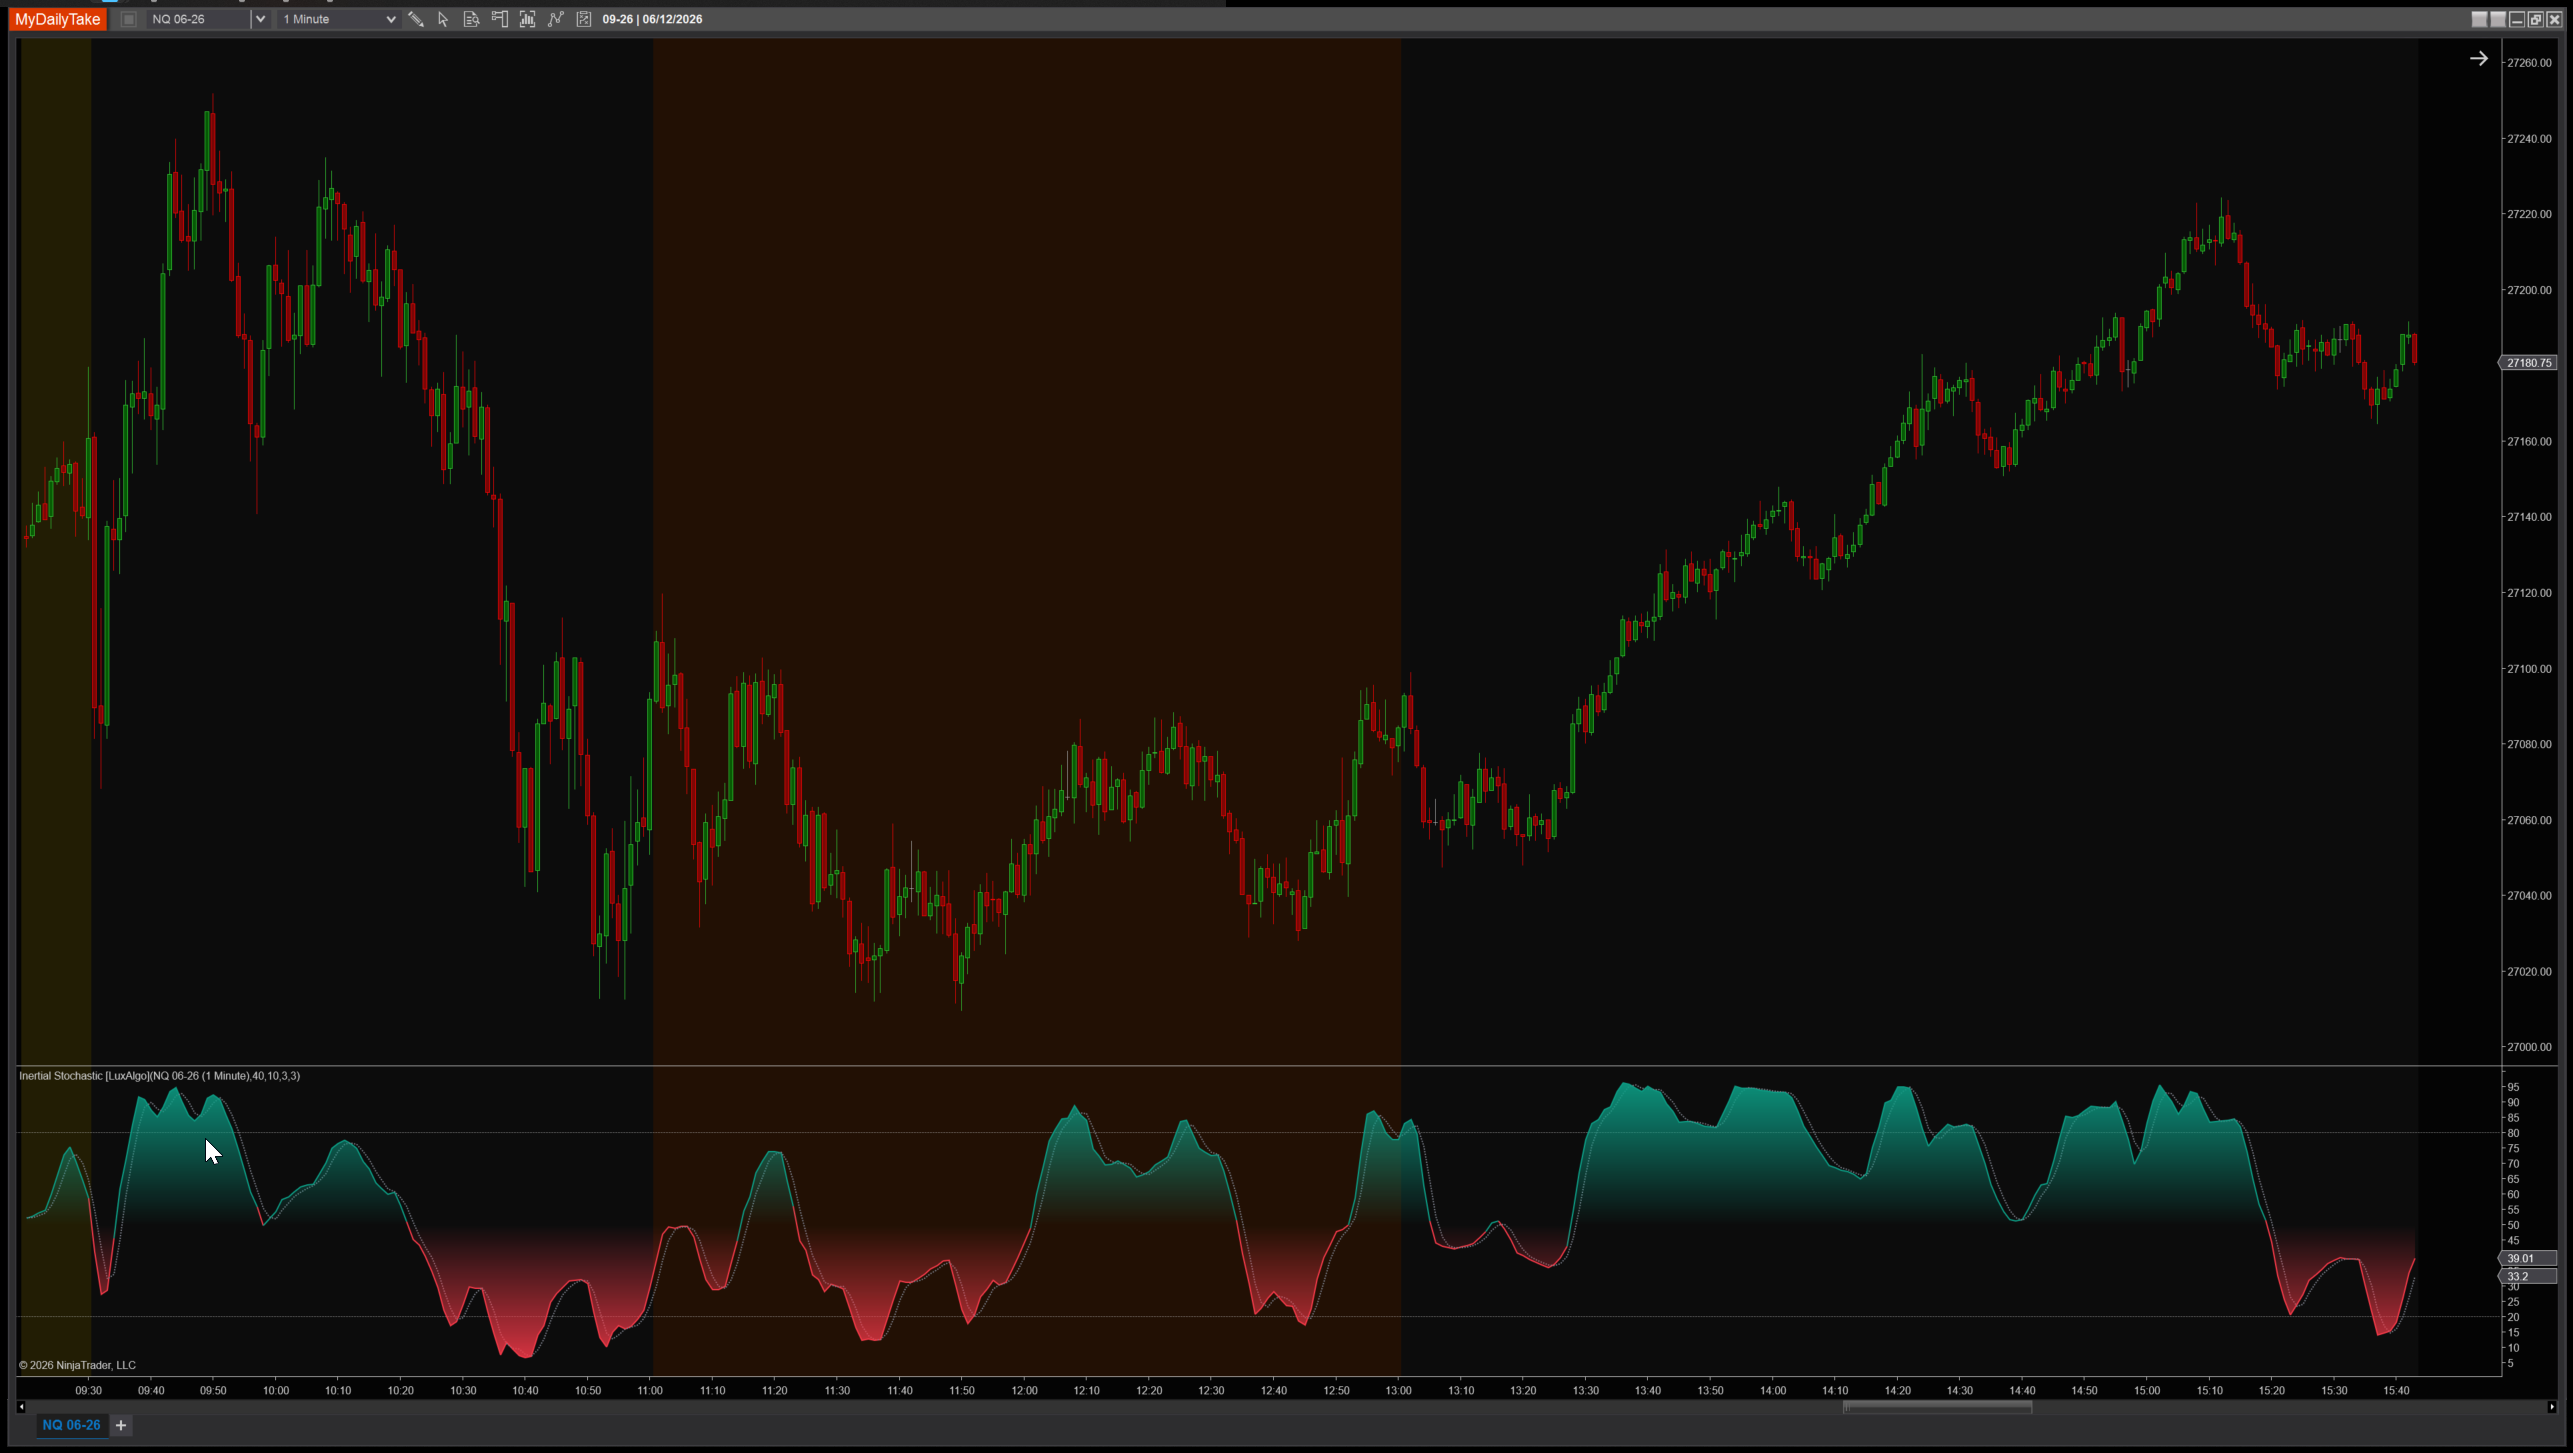
Inertial Stochastic on a 1-minute chart with default settings (Min=10, Max=40, K=D=3). The K line glides smoothly between extremes, resisting bar-by-bar noise. Above 50 it’s bull-colored with a vertical gradient fill toward the midline; below 50 it’s bear-colored with the symmetric gradient. The dotted D line and 80 / 20 reference lines round out the canonical stochastic look.


The original Pine Script™ code is by LuxAlgo and is licensed under the Attribution-NonCommercial-ShareAlike 4.0 International (CC BY-NC-SA 4.0). This NinjaTrader 8 adaptation is by MyDailyTake.com. The use of LuxAlgo’s name or adapted code does not imply endorsement by the original author.