Learn NinjaScript: Working with ChartControl and Custom Scaling
Text rendered at a fixed pixel offset looks fine at 100% zoom. Zoom out to see a week of bars and the text starts overlapping itself. Zoom in on a single day and there’s dead space. Overlays that look right across zoom levels need to know what the user is actually seeing — the canvas size, the bar range, the price range — and that means reading ChartControl and ChartScale.
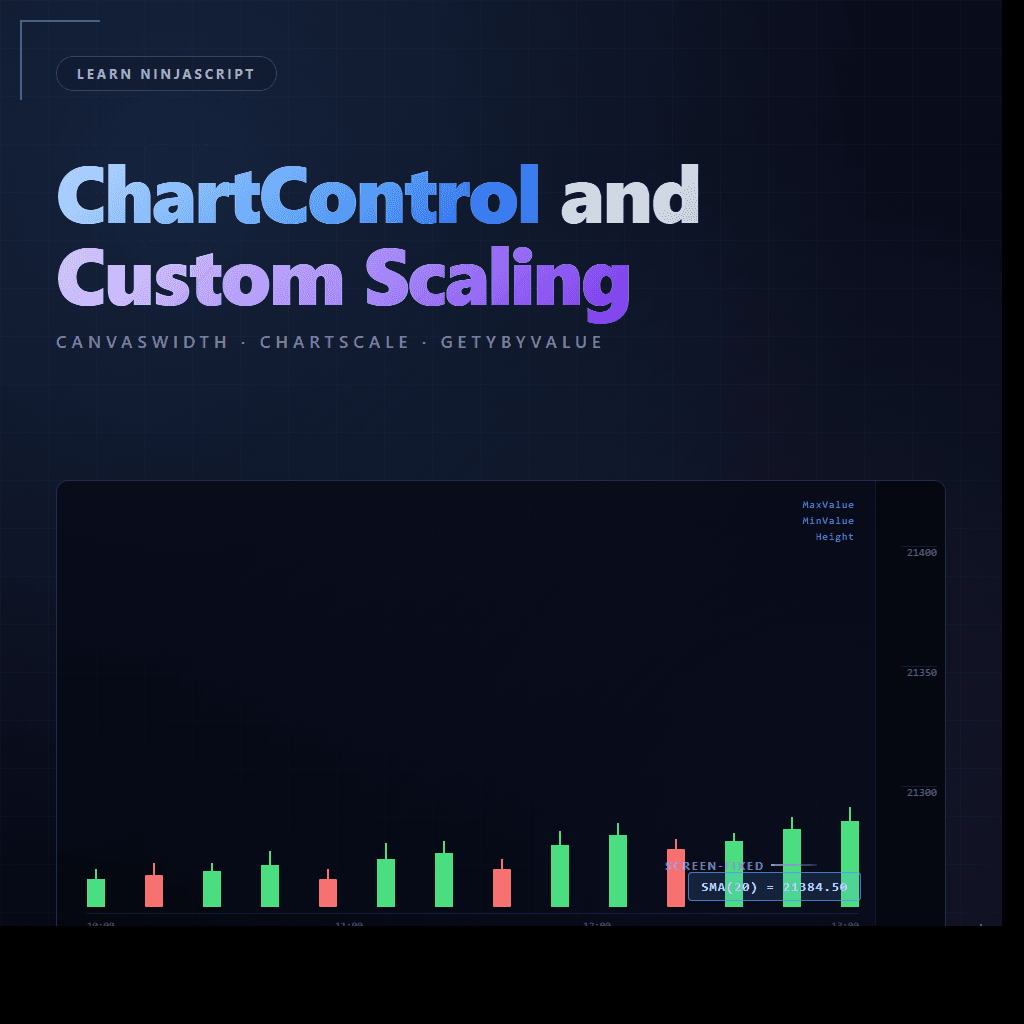
This post is the reference. ChartControl is the WPF host for the chart; ChartScale is the Y-axis state of one panel. Together they expose canvas dimensions, visible bar range, and pixel-to-value conversion — the minimum toolkit for any responsive overlay. The anchor example pins a value label to a corner of the panel regardless of how the user scales the chart.
⚙️ ChartControl Properties
ChartControl is only accessible inside OnRender — it’s the WPF control that hosts the chart, so it only exists once the chart is actually rendering. The properties you’ll reach for most:
CanvasWidth/CanvasHeight— full chart canvas in device-independent pixels. Scales with window size, so use these for proportional overlay positioning instead of hardcoded 800×600 assumptions.BarWidth/BarSpacing— per-bar pixel widths at the current zoom.BarWidth + BarSpacingis the distance between the left edges of two adjacent bars.GetXByBarIndex(ChartBars, absBarIdx)— the canonical way to map an absolute bar index to a pixel X. Don’t compute it yourself fromBarWidth; let NT handle the scroll offset.GetXByTime(dateTime)— same idea for wall-clock time. Useful for aligning external data to chart X coordinates.
📐 ChartScale and Pixel-to-Value Conversion
ChartScale is passed into OnRender as the second parameter. It represents the Y-axis state of the panel the indicator is rendering on. Each panel has its own — the price panel, a sub-panel, another sub-panel all carry independent scales.
MinValue/MaxValue— the lowest and highest prices currently visible on this panel.GetYByValue(price)— maps a price to a pixel Y coordinate. Changes every frame as the chart auto-rescales.GetValueByY(y)— inverse of the above. Handy when hit-testing or converting mouse coordinates.Height— pixel height of this panel specifically (not the whole chart —CanvasHeightis that).
Reading the chart state looks like this:
protected override void OnRender(ChartControl chartControl, ChartScale chartScale)
{
    base.OnRender(chartControl, chartScale);
    if (RenderTarget == null || ChartBars == null) return;

    float canvasW = (float)chartControl.CanvasWidth;
    float canvasH = (float)chartControl.CanvasHeight;
    float panelH  = (float)chartScale.Height;

    double priceHigh = chartScale.MaxValue;
    double priceLow  = chartScale.MinValue;
    double range     = priceHigh - priceLow;

    float xAt100Bars = chartControl.GetXByBarIndex(ChartBars, 100);
    float yAt4500    = (float)chartScale.GetYByValue(4500.0);

    // ... draw
}
📊 Visible Bar Range
ChartBars.FromIndex and ChartBars.ToIndex report the visible window — which absolute bar indices are currently on screen. They change when the user scrolls or zooms and are the correct bounds for any loop that draws per visible bar:
int fromIdx = Math.Max(ChartBars.FromIndex, 0);
int toIdx   = Math.Min(ChartBars.ToIndex,   CurrentBar);
if (toIdx <= fromIdx) return;

for (int j = fromIdx; j < toIdx; j++)
{
    float x = chartControl.GetXByBarIndex(ChartBars, j);
    double v = Values[0].GetValueAt(j);
    if (!Values[0].IsValidDataPointAt(j)) continue;
    float y = (float)chartScale.GetYByValue(v);
    // draw something at (x, y)
}
Two safeties matter here. The Math.Min(ChartBars.ToIndex, CurrentBar) clamp prevents overshoot at the right edge during Historical→Realtime transitions. The IsValidDataPointAt(j) check skips bars that were reset — drawing on a reset bar produces a random pixel where a plot gap should be.
🎯 Custom Y-Axis Behavior
NT’s auto-scaling is usually what you want — the Y-axis adjusts to fit the visible range of the main plot, and the user can lock, unlock, or toggle log scale from the chart UI. Overriding this is rare and usually a mistake.
The legitimate cases: a sub-panel indicator with a bounded range (like an oscillator pinned to 0–100), or an indicator whose output dwarfs price (a cumulative counter) and would otherwise compress the price plot into a flat line. For these, set IsOverlay = false so the indicator gets its own panel, and expose AutoScale on the plot if you want to let the user override:
AddPlot(new Stroke(Brushes.Cyan, 2), PlotStyle.Line, "RSI") followed by Plots[0].AutoScale = true; keeps the plot self-scaling within its own panel, with the price chart unaffected.
For SharpDX overlays that need a fixed range (a heatmap legend, a normalized ATR bar), read the panel height and compute your own Y positions from 0 (top) to Height (bottom) instead of going through chartScale.GetYByValue. This gives you panel-relative drawing that ignores the Y-axis entirely.
🛠️ The Anchor Example — Corner-Pinned Value Label
Extending MySma with a value label pinned to the bottom-right of the price panel. The label position doesn’t depend on bar index or price — only on canvas dimensions — so it stays readable no matter how the user zooms:
protected override void OnRender(ChartControl chartControl, ChartScale chartScale)
{
    base.OnRender(chartControl, chartScale);

    if (RenderTarget == null)    return;
    if (ChartBars    == null)    return;
    if (!IsVisible || IsInHitTest) return;
    if (!ShowCornerLabel)        return;

    int toIdx = Math.Min(ChartBars.ToIndex, CurrentBar);
    if (toIdx < Period) return;

    double sma = Values[0].GetValueAt(toIdx);
    string text = $"SMA({Period}) = " +
                  sma.ToString(Instrument.MasterInstrument.TickSize < 1 ? "F2" : "F0");

    // Screen-fixed position: 18px margin from bottom-right of the panel.
    float panelW = (float)chartControl.CanvasWidth;
    float panelH = (float)chartScale.Height;
    float x = panelW - 180f;
    float y = panelH - 36f;

    using (var layout = new SharpDX.DirectWrite.TextLayout(
        Core.Globals.DirectWriteFactory, text, textFormat, 170f, TextSize * 1.6f))
    {
        RenderTarget.DrawTextLayout(new SharpDX.Vector2(x, y), layout, dxText);
    }
}
The label reads CanvasWidth and Height per frame, so it follows the panel when the user resizes the window. The text itself still comes from the chart data — Values[0].GetValueAt(toIdx) — which means it updates in real time even though its pixel position never moves with the bars.
📝 Pitfalls Checklist
- Null
ChartControlduring teardown. Same class of bug asRenderTarget == null— during chart destruction,ChartControlcan be null insideOnRender. The standardRenderTarget/ChartBarsnull checks from Week 22 cover this case; keep them. - Reading
ChartControloutsideOnRender. InsideOnBarUpdate,ChartControlcan be null, stale, or throw cross-thread exceptions. If you need zoom state inOnBarUpdate, you’re probably doing somethingOnRendershould do. - Hardcoding canvas dimensions.
float x = 720f;only looks right at one window size. Always derive fromCanvasWidth/HeightorchartScale.Height. - Fighting auto-scaling. Setting custom Y-axis bounds on the main price panel creates a user-visible bug: their auto-scale button stops working as they expect. Don’t override global chart behavior to fix a per-indicator layout problem.
- Reading the wrong
ChartScale. TheChartScaleparameter passed to yourOnRenderis for your panel. Other panels have their own; you can’t read them from thisOnRender. If you need cross-panel coordination, use shared state between indicators — not cross-panel rendering. - Negative or zero canvas dimensions. During a resize,
CanvasWidthcan briefly be 0 or negative. ARenderTarget.DrawTextLayoutat(-80, 30)silently paints off-screen; a size-0TextLayoutthrows. Clamp to non-negative before using.