Learn NinjaScript: Calculate Modes: OnEachTick vs OnPriceChange vs OnBarClose
You wrote your first custom indicator. It plots cleanly, the math is right, you’re happy. Then you want to see it update live instead of only at bar close, so you flip Calculate from OnBarClose to OnPriceChange — a one-line change — and suddenly what shows up on the chart isn’t quite what it was before.
Maybe an arrow appears where it shouldn’t. Maybe a value flickers during the bar. Maybe the same indicator, loaded on a historical chart, draws different marks than when you watch it run live. The math didn’t change. Your code didn’t change. But the output did.
Calculate is one of those NinjaScript settings that looks like a simple toggle and isn’t. Each mode changes how often OnBarUpdate fires, and that changes how your code accumulates, compares, and plots. If you don’t know how your code behaves under each mode, you’ll end up with an indicator that’s technically working but silently wrong.
⚙️ What Calculate Actually Controls
Calculate is a property you set in State.SetDefaults (or from the indicator’s settings panel) that tells NinjaTrader one thing: how often to call your OnBarUpdate method.
That’s it. It doesn’t change what your code does — it changes how often your code runs. Every piece of logic in OnBarUpdate executes on every call, so the difference between modes is the cadence at which your variables update, your plots assign, and your Draw.* calls fire.
Three modes. One choice per indicator. Pick wrong for your use case, and the same arrow-drawing line of code can produce three different-looking charts.
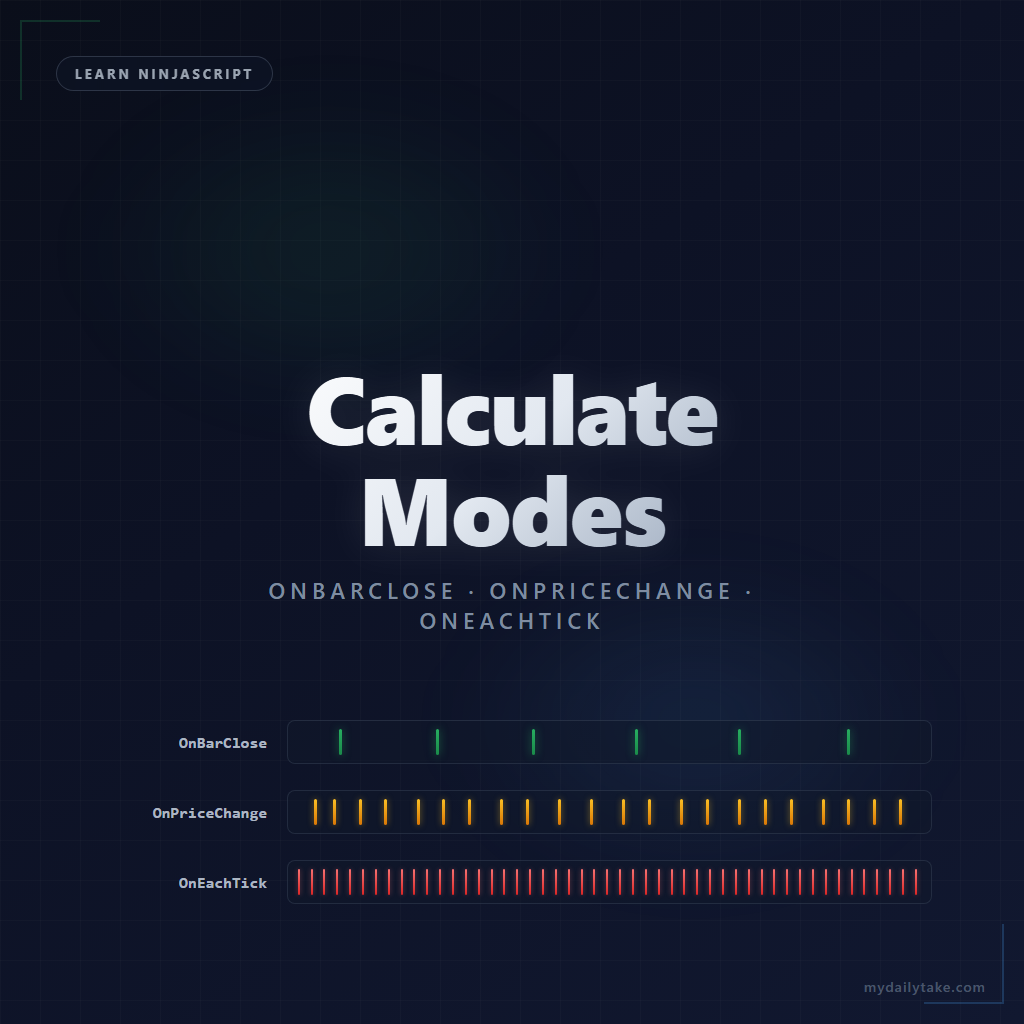
🔁 The Three Modes, Side by Side
Calculate Modes
| Mode | When OnBarUpdate fires | What that means for your plot | Typical indicator use |
|---|---|---|---|
| OnBarClose | Once per closed bar. Historical and live both fire at bar completion. | Plot values update only when a bar finishes. No intra-bar preview. | Moving averages, oscillators, or any logic that should only evaluate on completed bars. |
| OnPriceChange | Every time price changes. Same-price ticks are deduplicated. | Plot values update mid-bar as price moves. Intra-bar state changes need explicit handling. | Indicators that need a live-updating value but don't care about every tick u2014 running highs, VWAP, most live-reactive levels. |
| OnEachTick | Every incoming tick, including same-price ticks. | Fires hundreds to thousands of times per bar on active instruments. Same intra-bar gotchas as OnPriceChange, amplified. | Tick counting, volume-per-tick analysis, DOM work, order-flow indicators. |
🧠 OnBarClose — the default, and why
This is NinjaTrader’s default and the one you should start with. OnBarUpdate fires once when each bar completes. No mid-bar noise, no intra-bar state churn, no draw-object surprises.
Here’s a minimal indicator that draws an up arrow on every bar where Close crosses above a 20-period SMA:
protected override void OnStateChange()
{
    if (State == State.SetDefaults)
    {
        Name        = "Cross Above SMA";
        Calculate   = Calculate.OnBarClose;
        IsOverlay   = true;
        Period      = 20;
    }
}

protected override void OnBarUpdate()
{
    if (CurrentBar < Period) return;

    bool crossedAbove = Close[0] > SMA(Period)[0]
                     && Close[1] <= SMA(Period)[1];

    if (crossedAbove)
        Draw.ArrowUp(this, "cross_" + CurrentBar, false, 0,
                     Low[0] - TickSize * 2, Brushes.LimeGreen);
}

[NinjaScriptProperty]
[Range(2, int.MaxValue)]
public int Period { get; set; }
This runs cleanly. The condition — Close[0] > SMA(Period)[0] and Close[1] <= SMA(Period)[1] — can only evaluate to true after a bar has closed with a qualifying close price. OnBarUpdate fires once, evaluates the condition once, and draws the arrow once. If the condition is false, nothing is drawn, and nothing lingers from an earlier evaluation.
The trade-off: you only see the arrow after the bar closes. If a trader is watching price push above the SMA mid-bar and wants to see a live signal, they don’t get one. That’s by design with OnBarClose — it’s the reliable default, not the reactive one.
📈 OnPriceChange — and what happens to your arrow
Now suppose you want traders to see the arrow appear live — the moment price crosses the SMA — not one bar later. You flip Calculate to OnPriceChange and leave everything else alone:
Calculate = Calculate.OnPriceChange; // the only change
Run it. Watch a live chart. Here’s what happens:
Price ticks up and crosses above the SMA. OnBarUpdate fires. The condition Close[0] > SMA(Period)[0] evaluates true (because Close[0] reflects the current tick, not the bar’s final close). An arrow appears below the bar.
Price pulls back below the SMA. OnBarUpdate fires again. The condition evaluates false. Nothing happens — but the arrow is still on the chart. You didn’t remove it.
By bar close, maybe the bar ended below the SMA. There’s no “cross above” in the final print. But the arrow from thirty seconds ago is still sitting there, telling your trader a signal fired when it didn’t.
Now reload the chart against historical data. On historical replay, the condition evaluates on bars that are already complete — so the arrow only appears when the completed bar genuinely crossed above the SMA. Your historical chart looks clean and correct. Your live chart is a mess.
The fix: remove the draw object at the top of OnBarUpdate, then re-evaluate the condition and only draw if it’s currently true.
protected override void OnBarUpdate()
{
    if (CurrentBar < Period) return;

    string tag = "cross_" + CurrentBar;
    RemoveDrawObject(tag);               // clear any arrow from an earlier tick

    bool crossedAbove = Close[0] > SMA(Period)[0]
                     && Close[1] <= SMA(Period)[1];

    if (crossedAbove)
        Draw.ArrowUp(this, tag, false, 0,
                     Low[0] - TickSize * 2, Brushes.LimeGreen);
}
Now the arrow appears when the condition is true at the current tick and disappears when it’s false. By bar close, if the bar didn’t actually cross, no arrow remains. The live chart and the historical replay finally agree.
But this creates a different user experience: arrows flicker in and out as price oscillates around the SMA mid-bar. For some indicators that’s fine. For others it’s distracting. That’s a design choice, which is the next section.
⚡ OnEachTick — same gotcha, amplified
OnEachTick fires on every incoming tick, including ticks that don’t change the price. On a fast instrument like NQ or ES, this can be hundreds to thousands of calls per bar. Everything in the OnPriceChange section applies here — same draw-cleanup requirement, same historical-vs-live divergence if you don’t handle it — just more intense.
Don’t reach for OnEachTick unless you have a specific reason. Tick counting, tick-based reversal detection, volume-per-tick analysis, DOM work — those need the granularity. For most indicators, OnPriceChange gives you the same live-reactive behavior at a small fraction of the CPU cost.
If you do use it, be extra disciplined with draw-object cleanup and anything expensive in OnBarUpdate. Every line is now running thousands of times more often than it would on OnBarClose.
🎨 The Design Choice
Once you understand what’s happening mechanically, picking Calculate becomes a design question. Three choices, all valid depending on what you want your indicator to show.
Show the final state only. Run OnBarClose. Your indicator commits to signals only when a bar completes. Reliable and lagged. This is the right choice when you don’t want traders reacting to mid-bar noise — the bar close is the decision point, and anything before that is speculation.
Show the live state, including intra-bar churn. Run OnPriceChange with explicit draw-object cleanup. Signals appear and disappear as price moves inside the bar. This is the right choice when traders need early warning and understand that a live signal may invalidate before bar close.
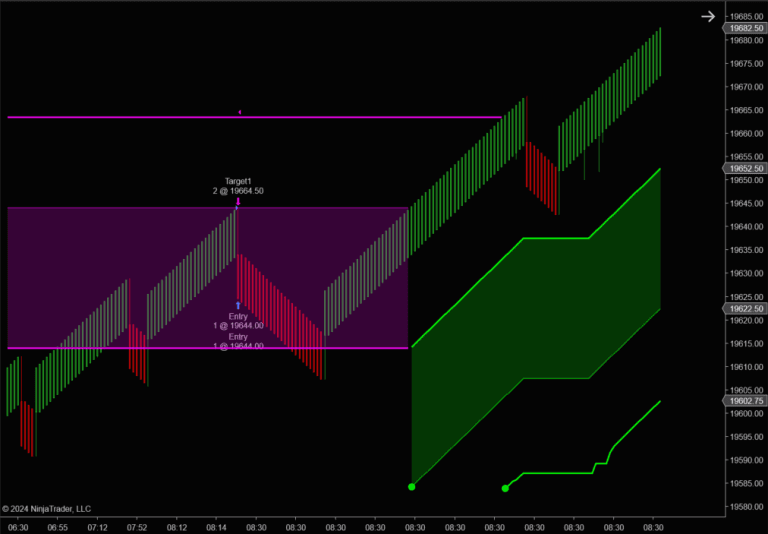
Show the final state with a live preview. Hybrid — draw a tentative “unconfirmed” marker during the bar, promote it to a confirmed marker at bar close. SuperTrend+ uses this pattern for its trend line: a yellow unconfirmed color while a reversal is being tested, then locks to green or red once the confirmation period elapses. More code, but the best of both worlds for traders who want awareness without commitment.
None of these is “right.” The mistake isn’t picking one — it’s writing an indicator without realizing you were picking one, and ending up with inconsistent behavior because your mode choice didn’t match your draw logic.
🆚 What This Means for Your Indicator’s Consistency
Here’s the bottom line for an indicator developer: if your code changes plot values or draws objects under conditions that can flip during a bar, and you’re running anything other than OnBarClose, you need to handle the cleanup yourself. If you don’t, your indicator’s historical replay won’t match its live behavior.
Your users will notice. They’ll load the indicator on a chart, see clean arrows on historical bars, and trust it. Then they’ll watch it run live and see extra arrows, missing arrows, or arrows that come and go as price moves. They’ll assume the indicator is broken. They’re not wrong — it is, in a subtle way that’s easy to miss during development.
The fix isn’t complicated once you see it: any draw call or plot assignment that depends on a condition that can flip within a bar needs cleanup at the top of OnBarUpdate, or you need to be running on OnBarClose where the problem doesn’t exist.
🎯 Which Mode Should I Pick?
Choosing a Calculate Mode
| If your indicator… | Use | Why |
|---|---|---|
| Computes moving averages, oscillators, or bar patterns from completed bars | OnBarClose | Logic only needs final bar values. Zero intra-bar complexity. |
| Draws signals (arrows, lines, text) based on conditions that are stable only at bar close | OnBarClose | Avoid the draw-cleanup gotcha entirely. |
| Needs to show a live-updating level, price, or running value | OnPriceChange | Fires mid-bar, deduplicates same-price ticks. Handle draw-object cleanup yourself. |
| Tracks running volume, cumulative delta, or anything that updates per transaction | OnEachTick | Same-price ticks still carry volume. OnPriceChange would miss them. |
| Counts ticks, drives a footprint chart, or integrates with DOM | OnEachTick | Genuine tick-level granularity is non-negotiable. Accept the performance cost. |
| You are not sure | OnBarClose | Start here. Switch to OnPriceChange only when you have a concrete reason, not a vague desire for live updates. |
📝 Pitfalls Checklist
Calculatemode changes how often your code runs, not what it does. Any line ofOnBarUpdatethat depends on a condition changing should be reviewed when you switch modes.- If you’re running
OnPriceChangeorOnEachTickand you draw objects based on intra-bar conditions, explicitly remove the draw object at the top ofOnBarUpdatebefore re-evaluating. Otherwise you’ll accumulate stale arrows and lines that never existed at bar close. - Don’t change
Calculateat runtime. Set it once inState.SetDefaultsand leave it. Changing it mid-run is a reliable way to break state your indicator has already built. - Before shipping an indicator that runs on anything other than
OnBarClose, load it on a chart with historical data, then watch it run on a live chart. The two views should agree. If they don’t, your draw or plot-assignment logic has a mid-bar state problem. OnEachTickis not a default. Pick it when you have a reason the other modes can’t satisfy. For most indicators,OnPriceChangeis the right “live-reactive” choice at much lower cost.
🎉 Prop Trading Discounts
💥89% off at Bulenox.com with the code MDT89