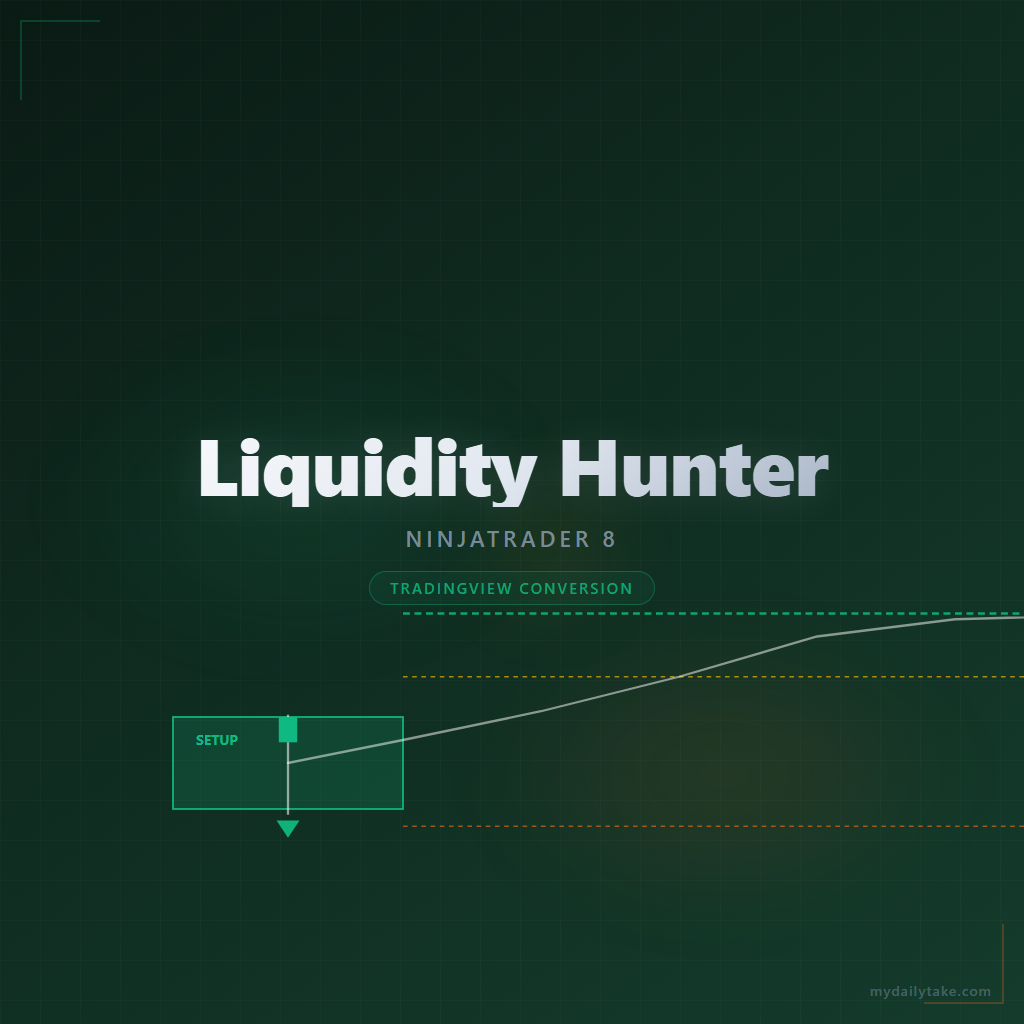
TradingView Liquidity Hunter [ChartPrime] Conversion to NinjaTrader 8
A ‘liquidity grab’ is the textbook reversal pattern: price spikes down, sweeps stops below a recent low, and snaps back up — a single candle with a small body and a long lower wick. ChartPrime’s Liquidity Hunter codifies this into a four-condition long-bias filter, then sizes the trade with an RR-based target, a CHOCH halfway-confirmation level, and a BOS failure level.
On a fresh setup, the indicator paints the candle, drops a wick % label above it, draws a dashed TP line that extends with the bar, and labels the CHOCH / BOS levels. The target label flips green on TP-hit, red on SL-hit. While the trade is on, BarBrushes paints the active bars in the trade color so the candle sequence reads as a clear setup → target / stop story.
This post is the NinjaTrader 8 conversion. The full source compiles standalone in indTradingView/, exposes the active-trade flag and per-bar wick/body diagnostics as Series<> outputs for strategy use, and is yours to download as a NinjaScript Archive.
Original Pine Script: Liquidity Hunter by ChartPrime
License: Mozilla Public License 2.0 (MPL 2.0)
🆚 What Makes Liquidity Hunter Different
Most candle-shape detectors look at one or two conditions: hammer / pin bar = long lower wick, small body, and call it a day. The result is a noisy signal that fires in trends, in chop, in irrelevant zones. Liquidity Hunter stacks four independent conditions that all have to align before the setup arms.
Four-condition AND filter. Body % ≤ 30 (the body is a small fraction of the bar’s total range). Lower wick % ≥ 60 (the wick has hunted liquidity below). Slope of close[1] vs close[2] is positive (the prior bar was already pulling up). Half-3-bar Z-band non-decreasing (volatility steady or expanding, not collapsing). Each condition rules out a different kind of false positive.
Pre-sized RR targets. Risk = |close − x2| where x2 = low − ATR(14) × 1.5. SL is one risk-unit below entry; TP is RR × risk above entry; CHOCH is the halfway mark; BOS is a separate failure level at low − Z×15. So every setup has an explicit risk, an explicit target, and an explicit invalidation point — no guesswork.
Live target tracking. While the trade is on, the dashed TP line extends with each new bar so the chart shows where you are relative to the target. The target label flips green on TP-hit / red on SL-hit, and the CHOCH / BOS levels print labels at their hit bars.
⚙️ Settings
Liquidity Hunter exposes its inputs in a single property group: the body / wick percentage thresholds, the targets toggle and RR ratio, and the label text size.
Core Settings
| Parameter | Default | Description |
|---|---|---|
| Body % | 30 | Body size as % of bar range must be at most this value for the setup to qualify. |
| Wick % | 60 | Lower-wick size as % of bar range must be at least this value for the setup to qualify. |
| Show Targets | True | Render the dashed TP line, the target label, and the CHOCH / BOS labels. |
| Target RR | 1.5 | Risk-reward multiplier sized into TP distance (TP = entry + RR × |close − x2|). |
| Label Text Size | Small | Text size for wick %, Target, CHOCH, and BOS labels. |
🧠 How It Works
Each closed bar runs the four-condition setup check on bar [1], then either arms a new trade or extends the active one toward TP / SL.
- Per-bar diagnostics. Compute lower wick % = (min(open, close) − low) / (high − low) × 100, body % = |open − close| / (high − low) × 100. Both are exposed as
Series<double>for strategies that want to gate on these directly. - Four-condition AND filter. All four of these must be true on bar [1] simultaneously: (1) body % ≤ Body% threshold, (2) lower wick % ≥ Wick% threshold, (3) close[1] − close[2] > 0 (positive slope), (4) the half-3-bar ATR-based Z-band is non-decreasing. Pass = setup armed.
- Target sizing. x2 = low[1] − ATR(14) × 1.5 (Wilder ATR with RMA TR — matches Pine’s
ta.atr). Risk = |close[1] − x2|. SL = close[1] − Risk. TP = close[1] + TargetRR × Risk. CHOCH = close[1] + (TargetRR / 2) × Risk. BOS = low[1] − Z × 15 (a wider failure level). - Setup paint. The setup bar is highlighted; a wick % label drops above it; the TP line is drawn dashed extending right; CHOCH / BOS levels are pre-drawn so you can see the geometry of the trade.
- Live trade tracking. Each subsequent bar, while the trade is on, the TP line is extended one bar; CHOCH / BOS hit-tests run on the bar’s high / low / close; BarBrushes paints the active bar in the trade color.
- TP / SL resolution. When high crosses TP: target label flips green and the trade closes. When low crosses SL: target label flips red and the trade closes. LongActive returns to false either way; the chart artifacts persist for the historical record.
The indicator is non-repainting — setup detection uses bar [1]’s closed values; TP / CHOCH / BOS hit-tests use closed-bar high / low / close.
🛠️ Using It in a Strategy
Liquidity Hunter is built around a single setup pattern with explicit targets — a strategy can lean on it directly. The example below enters long the bar after a fresh LongActive transition, places a stop at the indicator’s SL level, and sets a target at the TP level. The indicator’s CHOCH / BOS labels stay on the chart for visual confirmation of the trade’s progress.
Below is the lifecycle: instantiate in State.DataLoaded, then in OnBarUpdate watch for the LongActive transition.
private LiquidityHunter lh;

protected override void OnStateChange()
{
    if (State == State.SetDefaults)
    {
        Name = "LiquidityHunterStrategyExample";
    }
    else if (State == State.DataLoaded)
    {
        lh = LiquidityHunter(
            30,                                       // Body %
            60,                                       // Wick %
            true,                                     // Show Targets
            1.5,                                      // Target RR
            LiquidityHunter_TextSize.Small            // Label Text Size
        );
    }
}

protected override void OnBarUpdate()
{
    if (CurrentBar < 30) return;

    // Fresh setup armed this bar
    bool freshLong = lh.LongActive[0] && !lh.LongActive[1];

    if (freshLong && Position.MarketPosition != MarketPosition.Long)
    {
        // Compute the same risk distance the indicator drew on chart.
        // The indicator's x2 = low[1] - ATR(14)*1.5; risk = |close[1] - x2|.
        double atr14 = ATR(14)[1];
        double risk  = Math.Abs(Close[1] - (Low[1] - atr14 * 1.5));
        double sl    = Close[1] - risk;
        double tp    = Close[1] + 1.5 * risk;

        EnterLong();
        SetStopLoss(CalculationMode.Price, sl);
        SetProfitTarget(CalculationMode.Price, tp);
    }
}
LongActive[0] is true while the trade is on; LongActive[1] is false on the bar the trade armed — that’s the entry trigger. The diagnostic LowerWickPctSeries / BodyPctSeries series can layer additional filters on top.
Public Outputs
| Output | Type | Description |
|---|---|---|
| LongActive[0] |
Series | True while a long trade is currently armed (between entry and TP / SL hit). |
| LowerWickPctSeries[0] |
Series | Diagnostic — lower-wick size as % of bar range for bar [1]. |
| BodyPctSeries[0] |
Series | Diagnostic — body size as % of bar range for bar [1]. |
🔄 Conversion Notes
A few things changed in the translation from Pine Script to NinjaScript:
Wilder ATR via NT8’s RMA-default ATR. Pine’s ta.atr(14) uses RMA-style smoothing internally. NT8’s ATR primitive is RMA-based by default, so a single ATR(14) call matches the Pine output exactly — no inline implementation needed.
BarBrushes for active-trade coloring. Pine’s barcolor() for the active trade window becomes per-bar BarBrushes[0] + CandleOutlineBrushes[0] assignments while tradeOn is true. The bars repaint live as the trade progresses.
Dashed TP line via Draw.Line with extended right anchor. Pine’s line.new with extend.right becomes a Draw.Line with a stable tag, redrawn each bar with the right anchor moved to the current bar so the dashed TP extends along with the live trade.
Target label color flip via two-pass redraw. Pine’s label.set_textcolor on TP / SL hit becomes a remove + redraw of the target label with the new color brush — same visual, no tag-mutation gymnastics.
Diagnostic series instead of data-window plots. Pine’s small numeric plots for body % / lower wick % don’t translate well to a price-overlay indicator (their 0–100 scale would crush the price axis). The conversion exposes them as Series<double> outputs (LowerWickPctSeries / BodyPctSeries) for strategy use; the data window still shows them through standard NT8 plumbing.
Z-band label fixed font. Pine’s text_size = size.auto isn’t reproducible in NT8’s drawing layer. The Z-band label uses a fixed 9pt font instead — readable at all chart scales without auto-scaling artifacts.
📦 Download
The full source is available as a free NinjaScript Archive. To install:
- Download the
.zipfile below. - In NinjaTrader 8, go to Tools → Import → NinjaScript Add-On.
- Select the downloaded
.zipfile. - The indicator will appear under Indicators → indTradingView → Liquidity Hunter [ChartPrime] on your chart.
📊 Chart Example
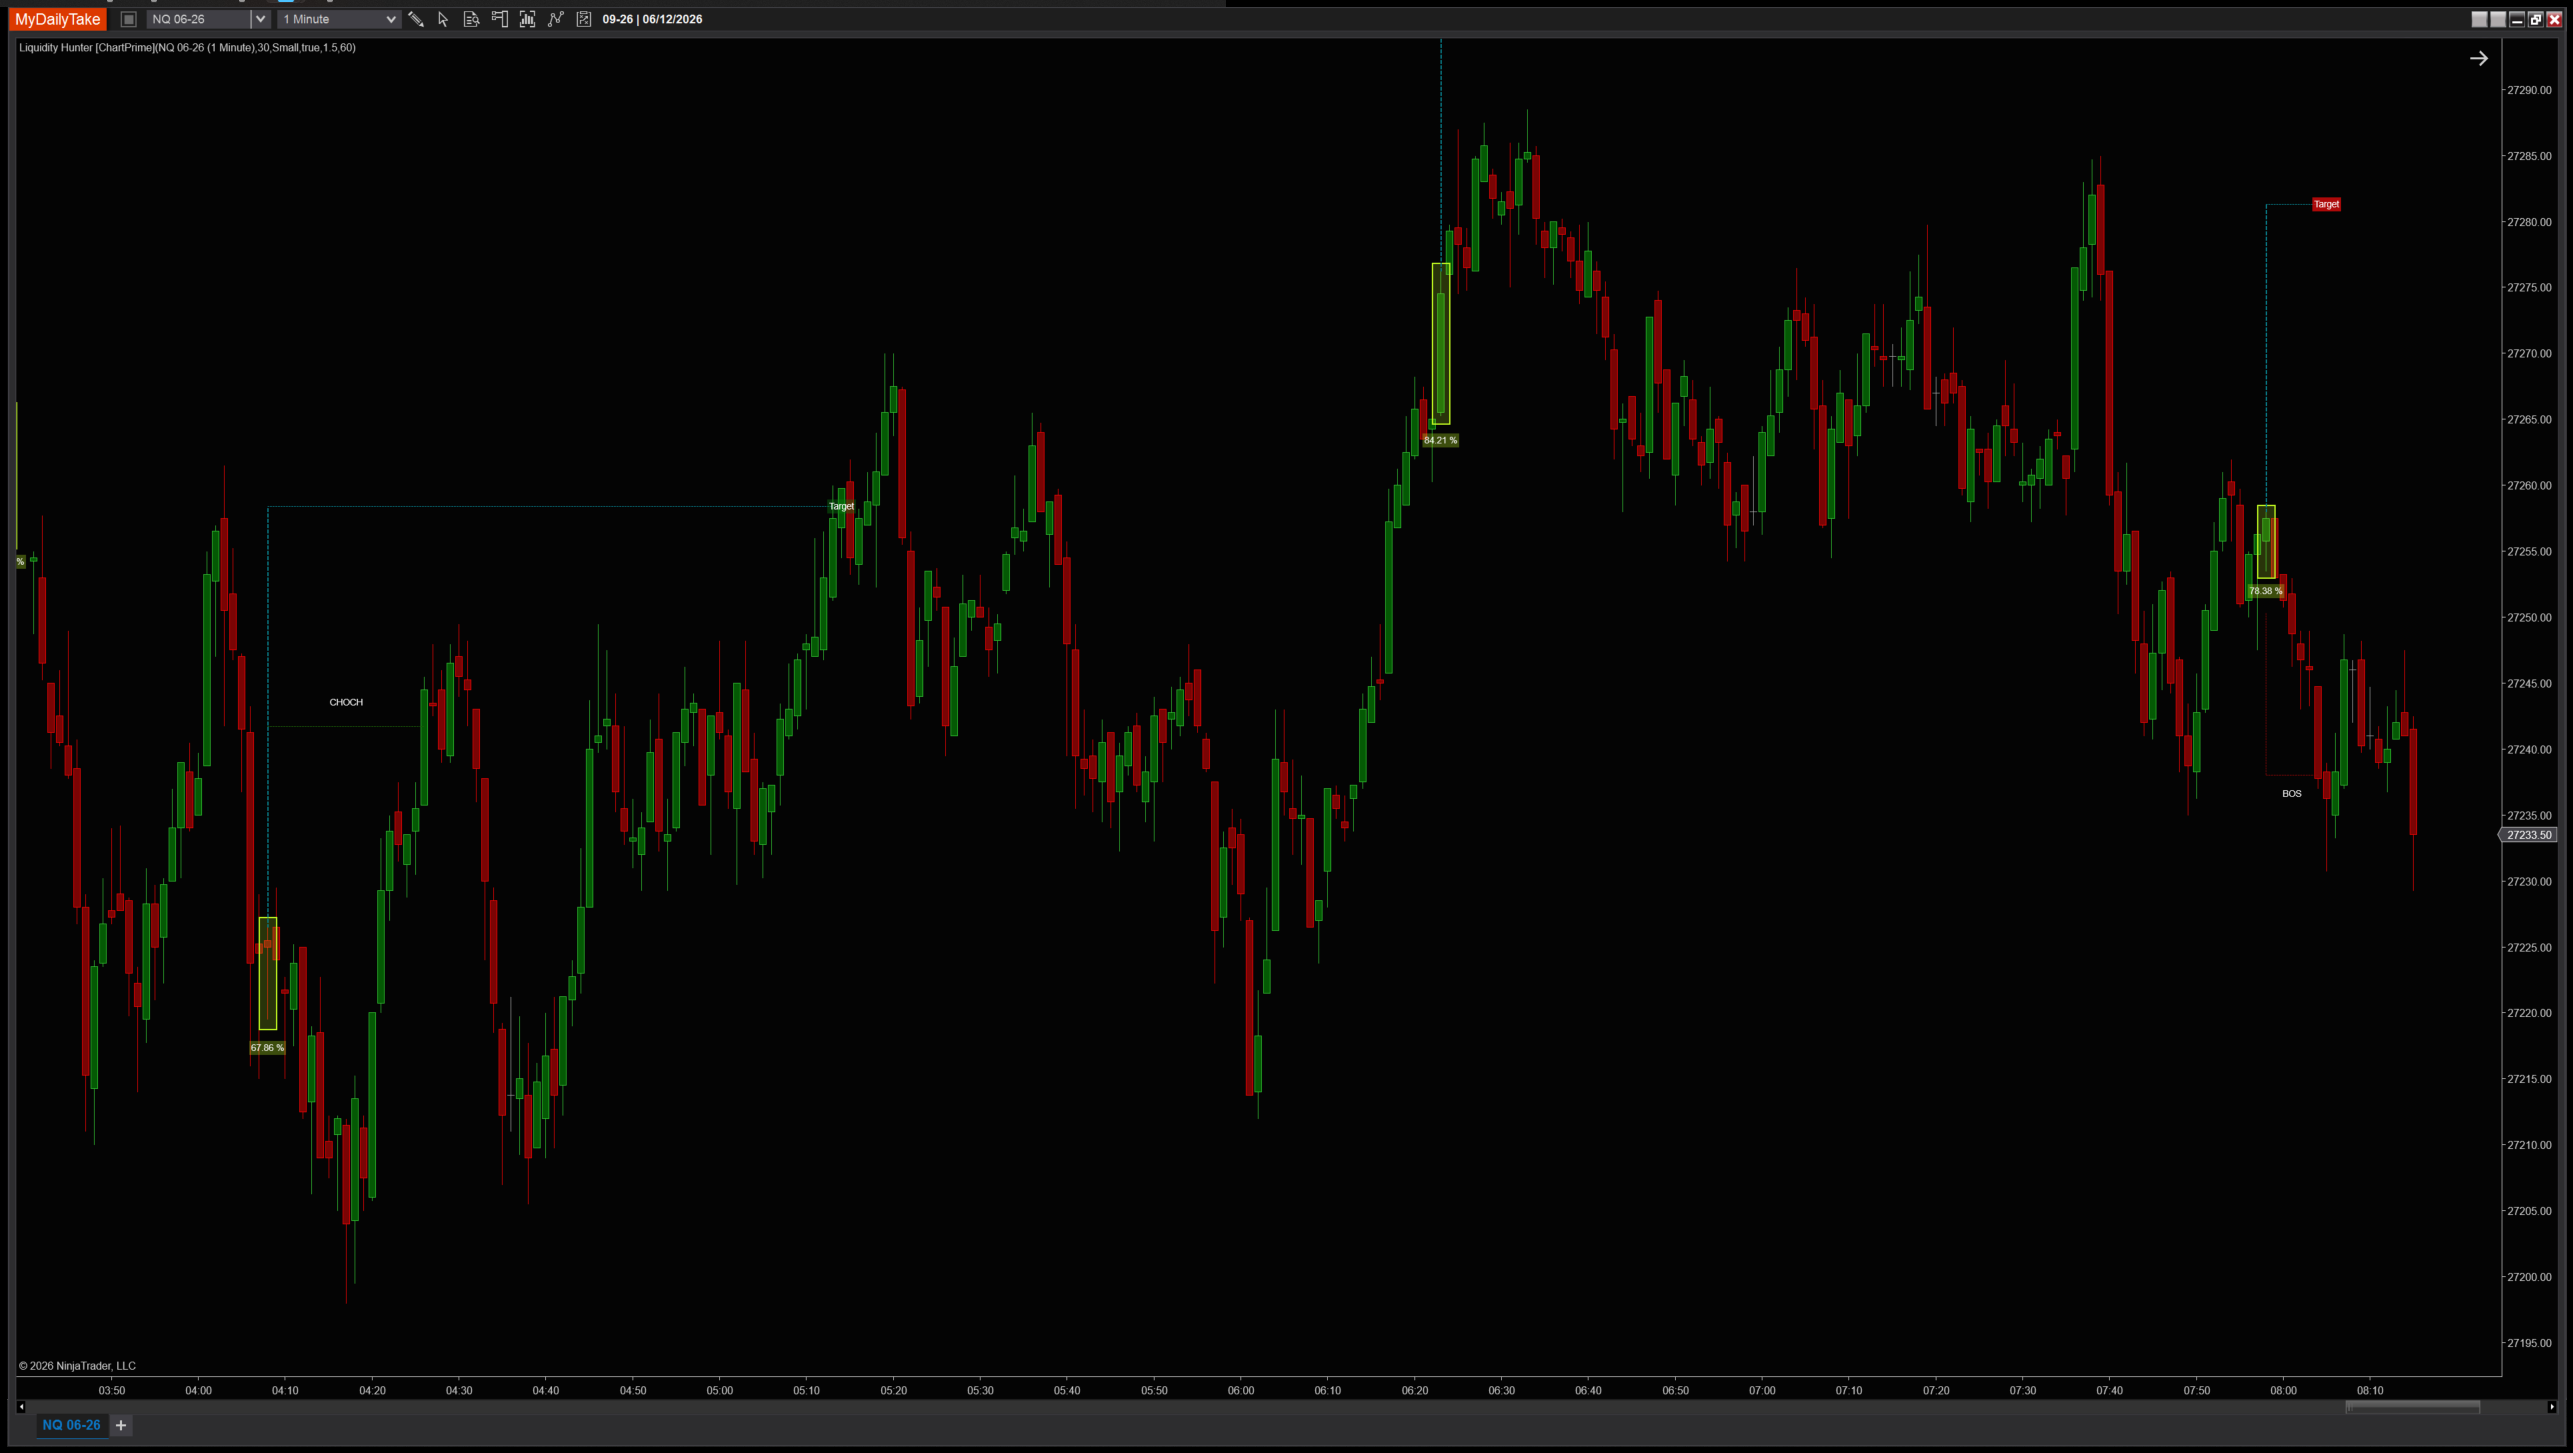
Liquidity Hunter on a 1-minute chart with default settings (Body=30, Wick=60, RR=1.5). Each setup paints the candle, drops a wick % label, and draws the dashed TP target line. CHOCH and BOS labels print at the halfway and failure levels. While the trade is on, the active bars repaint in the trade color; the target label flips green on TP-hit / red on SL-hit when the trade resolves.


The original Pine Script™ code is by ChartPrime and is licensed under the Mozilla Public License 2.0 (MPL 2.0). This NinjaTrader 8 adaptation is by MyDailyTake.com. The use of ChartPrime’s name or adapted code does not imply endorsement by the original author.