TradingView Kalman Volume Trend [BigBeluga] Conversion to NinjaTrader 8
A Kalman filter is the natural response to noisy price data — recursively estimate the underlying state and downweight new observations by how much you trust them. BigBeluga’s Kalman Volume Trend takes that idea, applies it to close, and stacks volume context around the resulting trend line: per-bar volume delta bars sized by the normalized signed volume, plus a bottom-right HUD that tracks the cumulative buy / sell / delta totals inside the current trend.
The Kalman line is the trend; ±ATR(200)×Mult bands sit on either side; the trend flips when close commits past the active band. Per-bar SharpDX rectangles extend outward from the line by ATR(200) × |normalized delta|, colored by delta sign. A 10-row gradient histogram in the corner reads off cumulative volume, and the counters reset at every trend flip — so the HUD is always ‘this trend’s volume,’ not ‘all-time volume.’
This post is the NinjaTrader 8 conversion. The full source compiles standalone in indTradingView/, exposes the Kalman trend line, the trend state, and the normalized delta as Series<> outputs for strategy use, and is yours to download as a NinjaScript Archive.
Original Pine Script: Kalman Volume Trend by BigBeluga
License: Attribution-NonCommercial-ShareAlike 4.0 International (CC BY-NC-SA 4.0)
🆚 What Makes Kalman Volume Trend Different
Most trend filters are moving averages with a fixed weighting kernel — exponential, weighted, hull. They have no feedback. A Kalman filter does: it tracks an estimate of the state and the uncertainty in that estimate, updating both each bar based on how much new data should be trusted. The Process Noise (Q) and Measurement Noise (R) settings control that trust budget directly.
Sticky ±ATR bands. Standard trend filters flip on cross. This one flips only when close commits past the band — and the band on the opposite side trails along while you’re in the trend. So a small wick into the opposite zone is ignored; only a clean break flips the state.
Per-bar volume delta bars. Each bar gets a SharpDX rectangle pointing outward from the trend line, sized by ATR(200) × |normalized delta|. Color is the delta sign (close > open = bull color, otherwise bear). The light/dark two-tone envelope makes the volume direction read at a glance.
HUD with cumulative trend stats. A bottom-right SharpDX HUD with three 10-row gradient histograms (BUY / SELL / DELTA) plus a TOTAL VOLUME footer. The counters reset at every trend flip, so ‘this trend’s BUY column’ versus ‘this trend’s SELL column’ is the read.
⚙️ Settings
Kalman Volume Trend exposes its inputs in four property groups: the Kalman + band parameters, the volume-extremes labeling, the dashboard toggle and font size, and the trend colors used everywhere else.
Parameters
| Parameter | Default | Description |
|---|---|---|
| Process Noise (Q) | 0.0005 | How much the underlying trend is expected to change. Lower = smoother / slower; higher = more responsive. |
| Measurement Noise (R) | 0.4 | Uncertainty in the price input. Higher = more smoothing (filter trusts its own prediction over new data). |
| Band Multiplier | 2.0 | ATR(200) multiplier defining how far close must commit beyond the Kalman line to flip the trend. |
Volume Extremes
| Parameter | Default | Description |
|---|---|---|
| Show Volume Extremes | True | Mark bars where |normalized delta| > threshold with X / value labels. |
| Volume Extreme Threshold | 1.5 | Absolute value of normalized delta above which an extreme is flagged. |
Dashboard
| Parameter | Default | Description |
|---|---|---|
| Show Dashboard | True | Render the BUY / SELL / DELTA / TOTAL VOLUME HUD at the bottom-right. |
| Label Text Size | Small | Font size for both the dashboard cells and the volume-extreme labels. |
Colors
| Parameter | Default | Description |
|---|---|---|
| Up Trend Color | #1A6CCA | Trend line, bull volume bars, and bull HUD column. |
| Down Trend Color | #CA1AAD | Trend line, bear volume bars, and bear HUD column. |
🧠 How It Works
Each bar runs the Kalman recurrence on close, then computes the band positions, the normalized delta, and the dashboard rollups.
- Kalman recurrence. Predicted state = prior state. Predicted variance = prior variance + Q. Kalman gain K = predicted variance / (predicted variance + R). Updated state = predicted + K × (close − predicted). Updated variance = (1 − K) × predicted variance. The result is the smoothed trend estimate.
- Band positions. Compute ATR(200) × BandMultiplier. The trend bands sit at KFLine ± that width, but only the active side trails — the inactive band keeps its prior value to make flips sticky.
- Trend flip. If currently up, flip down only if close < lower band. If currently down, flip up only if close > upper band. On the flip, reset the cumulative HUD counters.
- Normalized delta. Raw signed volume = (close > open ? +volume : −volume). Normalize against the highest |raw signed volume| over 100 bars, scaled to ±2. So a delta of +1.5 is ‘unusually bullish for the recent window.’
- Per-bar volume bars. SharpDX rectangle from KFLine outward by ATR(200) × |normalized delta|, in the bull or bear color, with a light / dark two-tone envelope. The bar’s tip is exposed as a
Series<double>for diagnostic plots if needed. - Dashboard accumulation. While the trend holds, accumulate BUY (positive deltas), SELL (negative deltas), DELTA (signed total), and total volume. Each is normalized against the trend’s running max so the histogram bars fill in proportionally. Counters reset at every flip.
- Volume extremes. If |normalized delta| > VolumeExtremeThreshold, drop an X label at the bar with the actual delta value — fast filter for outlier-volume bars.
The indicator is non-repainting: every Kalman update, band evaluation, and dashboard rollup uses only closed-bar data.
🛠️ Using It in a Strategy
Kalman Volume Trend is built around the trend state. The most natural strategy use is to enter on IsUptrend flips and trail along the KFLine — letting the Kalman recurrence be the stop level and the band-locking flip be the exit.
Below is the lifecycle: instantiate in State.DataLoaded, then in OnBarUpdate watch for trend flips and trail the stop along the Kalman line.
private KalmanVolumeTrend kvt;

protected override void OnStateChange()
{
    if (State == State.SetDefaults)
    {
        Name = "KalmanVolumeTrendStrategyExample";
    }
    else if (State == State.DataLoaded)
    {
        kvt = KalmanVolumeTrend(
            0.0005,                                    // Process Noise (Q)
            0.4,                                       // Measurement Noise (R)
            2.0,                                       // Band Multiplier
            true,                                      // Show Volume Extremes
            1.5,                                       // Volume Extreme Threshold
            true,                                      // Show Dashboard
            KalmanVolumeTrend_TextSize.Small           // Label Text Size
        );
    }
}

protected override void OnBarUpdate()
{
    if (CurrentBar < 220) return;  // Past ATR(200) warmup

    bool flippedUp   =  kvt.IsUptrend[0] && !kvt.IsUptrend[1];
    bool flippedDown = !kvt.IsUptrend[0] &&  kvt.IsUptrend[1];

    if (flippedUp)
    {
        EnterLong();
        SetStopLoss(CalculationMode.Price, kvt.KFLine[0]);
    }
    if (flippedDown)
    {
        EnterShort();
        SetStopLoss(CalculationMode.Price, kvt.KFLine[0]);
    }

    // Trail the stop along the Kalman line every bar
    if (Position.MarketPosition == MarketPosition.Long)
        SetStopLoss(CalculationMode.Price, kvt.KFLine[0]);
    else if (Position.MarketPosition == MarketPosition.Short)
        SetStopLoss(CalculationMode.Price, kvt.KFLine[0]);
}
All three outputs are Series<>. kvt.IsUptrend[1] reads yesterday’s trend state for the flip detection.
Public Outputs
| Output | Type | Description |
|---|---|---|
| KFLine[0] |
Series | The Kalman trend line value. Usable as a trailing stop. |
| IsUptrend[0] |
Series | True in an uptrend, false in a downtrend. |
| Delta[0] |
Series | Normalized signed volume in [−2..2]. Sign = direction, magnitude = strength. |
🔄 Conversion Notes
A few things changed in the translation from Pine Script to NinjaScript:
Kalman recurrence inlined. Pine’s recursive Kalman filter is implemented as two scalar fields (kalmanX, kalmanP) updated each bar. NaN-seeded so the first bar is just close. Q and R are exposed as user properties for tuning.
Sticky bands via per-direction state. The opposite band’s value is held across bars while the trend holds, then reset on the flip. This matches Pine’s var-style retention.
Per-bar volume bars via SharpDX rectangles. Pine’s plotcandle for the volume bars becomes per-bar SharpDX rectangles in OnRender, with the two-tone light/dark envelope drawn as a thin outer rectangle in the dark variant.
HUD via SharpDX with DirectWrite text. Pine’s table with the multi-row gradient histograms is recreated as a 10-row SharpDX HUD anchored to the bottom-right of the chart. A 10-step opacity ladder per direction gives the gradient look without per-cell brush construction.
Volume-extreme labels via Draw.Text. Pine’s plotchar on extreme-volume bars becomes Draw.Text calls with SimpleFont sized by the LabelTextSize enum.
Series-based public outputs. KFLine, IsUptrend, and Delta are exposed as Series<> for strategy consumers — flip detection is IsUptrend[0] != IsUptrend[1].
📦 Download
The full source is available as a free NinjaScript Archive. To install:
- Download the
.zipfile below. - In NinjaTrader 8, go to Tools → Import → NinjaScript Add-On.
- Select the downloaded
.zipfile. - The indicator will appear under Indicators → indTradingView → Kalman Volume Trend [BigBeluga] on your chart.
📊 Chart Example
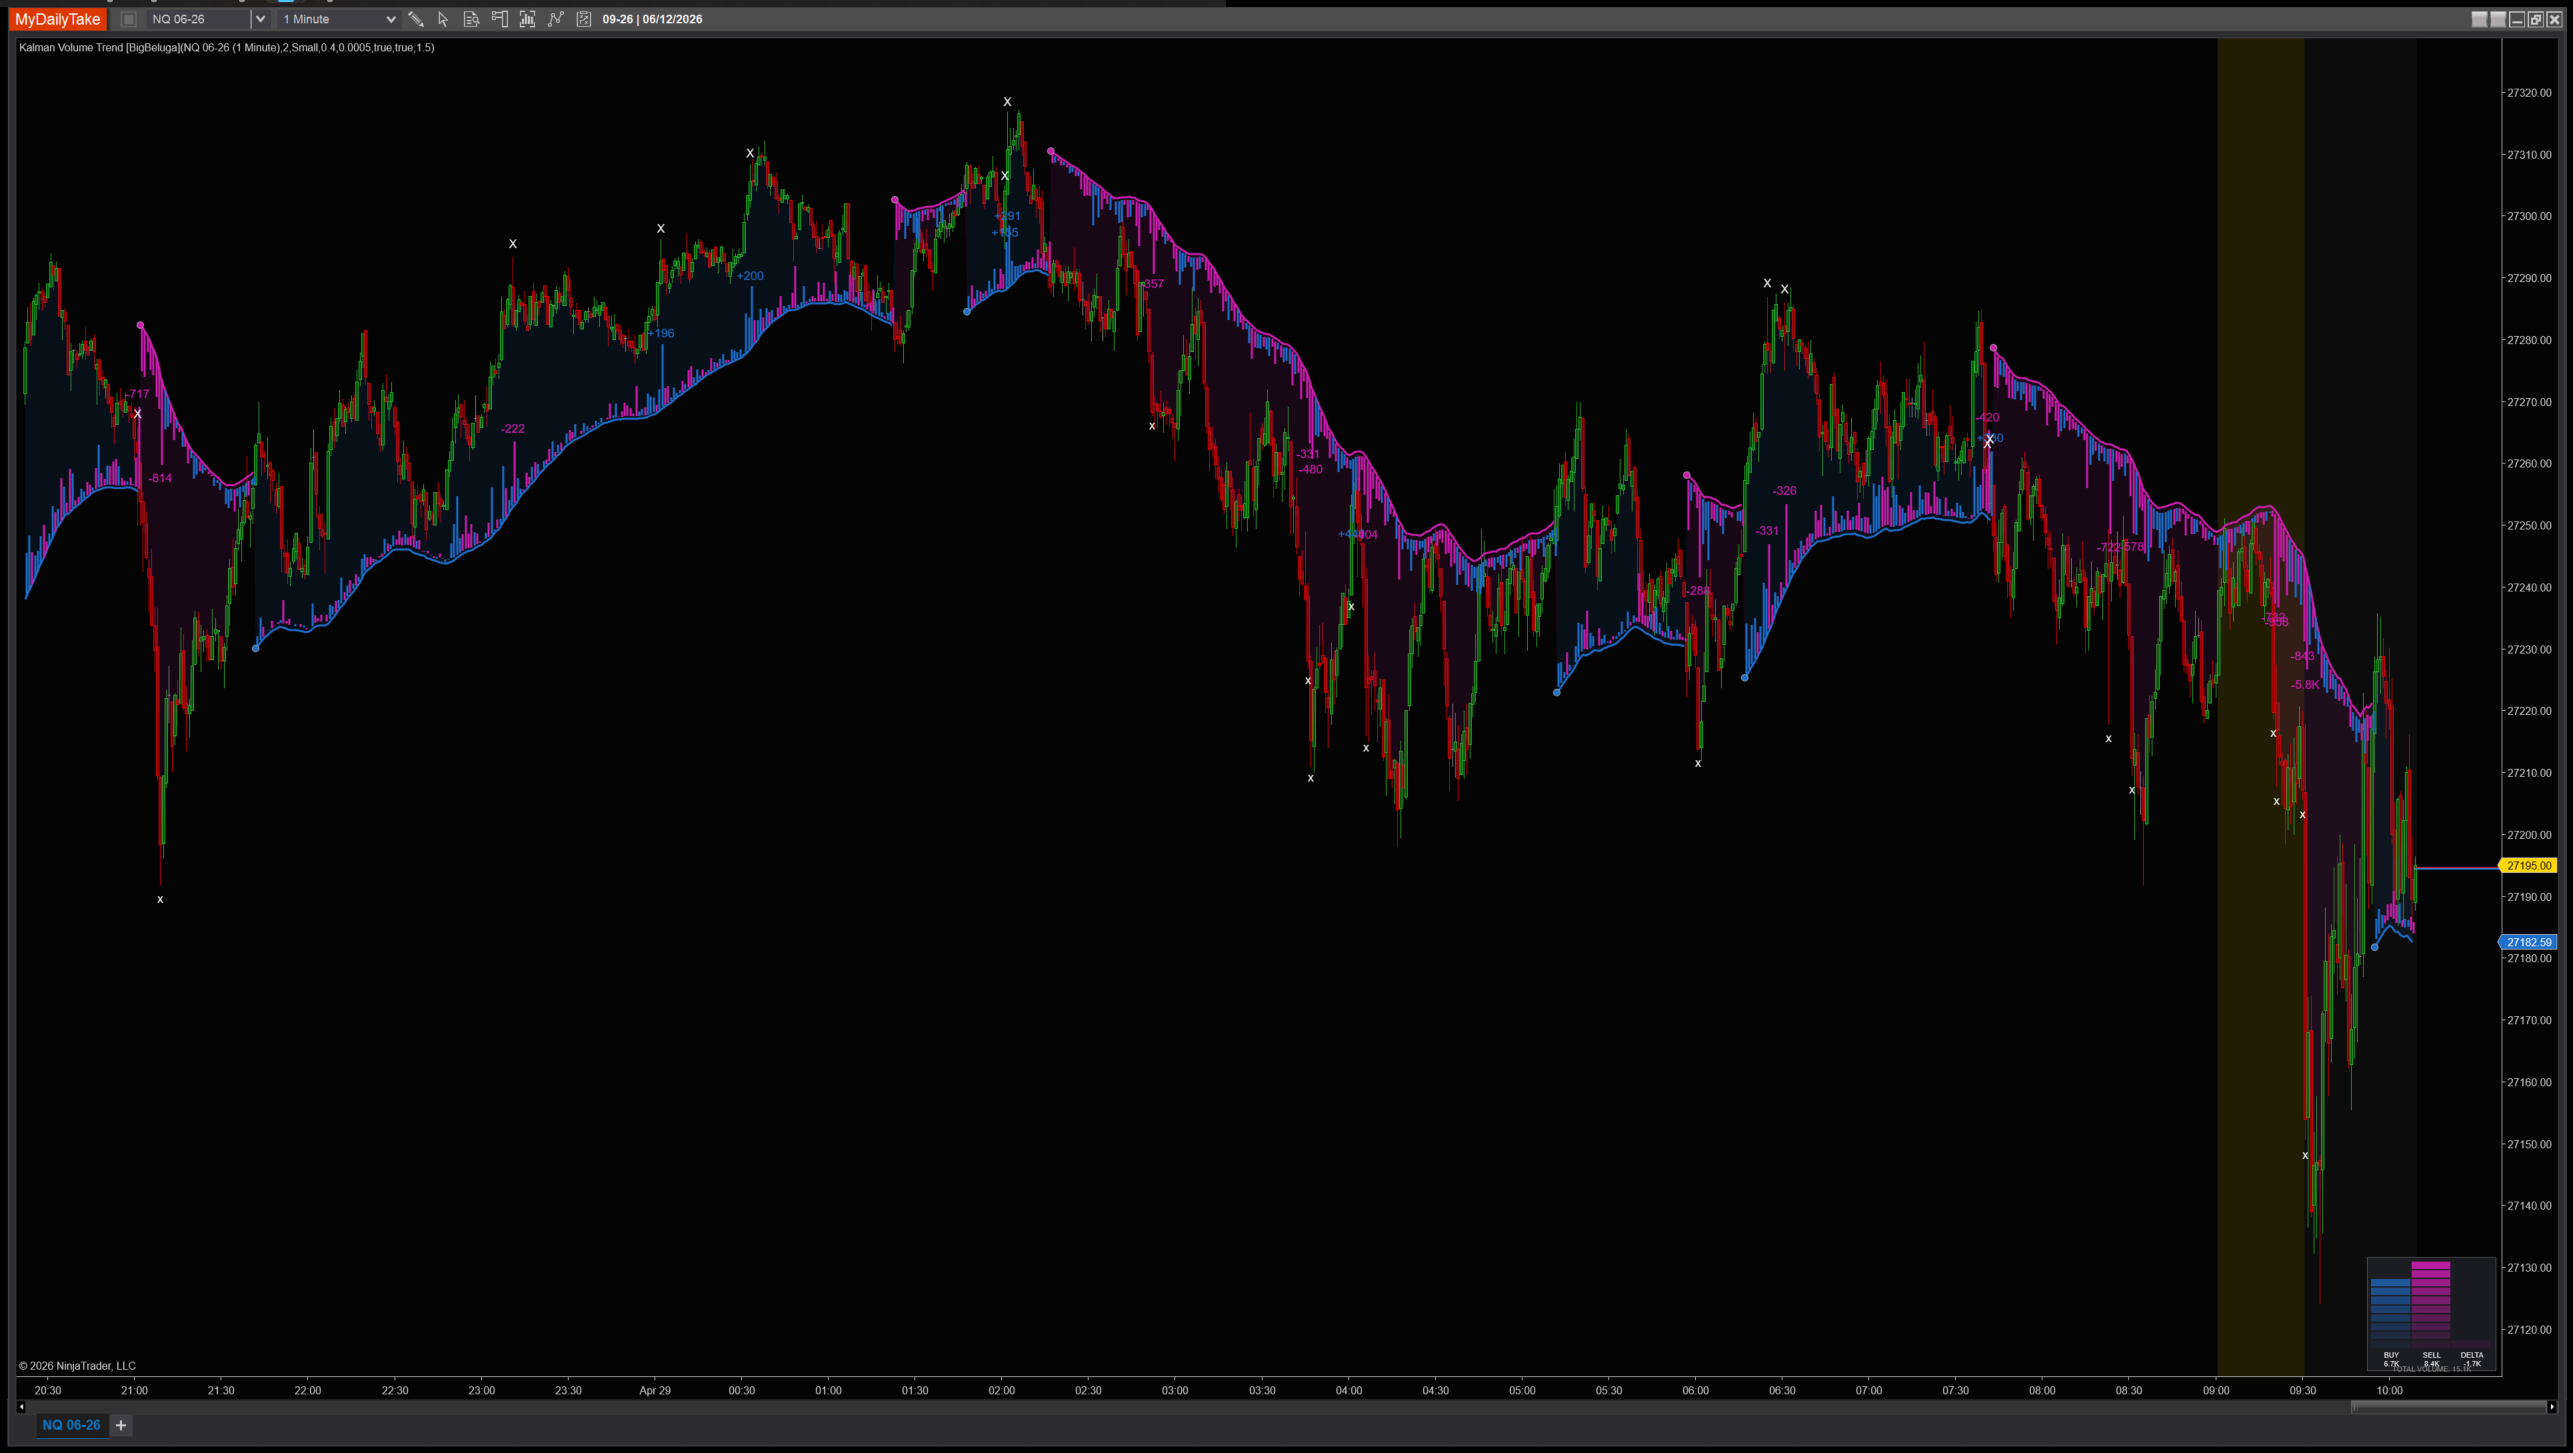
Kalman Volume Trend on a 1-minute chart with default settings. The Kalman line glides through the noise with sticky ±ATR bands holding through small wick excursions. Per-bar SharpDX volume bars extend outward from the trend line in bull and bear colors — length is the normalized delta magnitude. The bottom-right HUD shows cumulative BUY / SELL / DELTA columns plus the trend’s total volume, all reset at the most recent flip.


The original Pine Script™ code is by BigBeluga and is licensed under the Attribution-NonCommercial-ShareAlike 4.0 International (CC BY-NC-SA 4.0). This NinjaTrader 8 adaptation is by MyDailyTake.com. The use of BigBeluga’s name or adapted code does not imply endorsement by the original author.