Learn NinjaScript: Detecting Crosses, Flips, and Directional Shifts
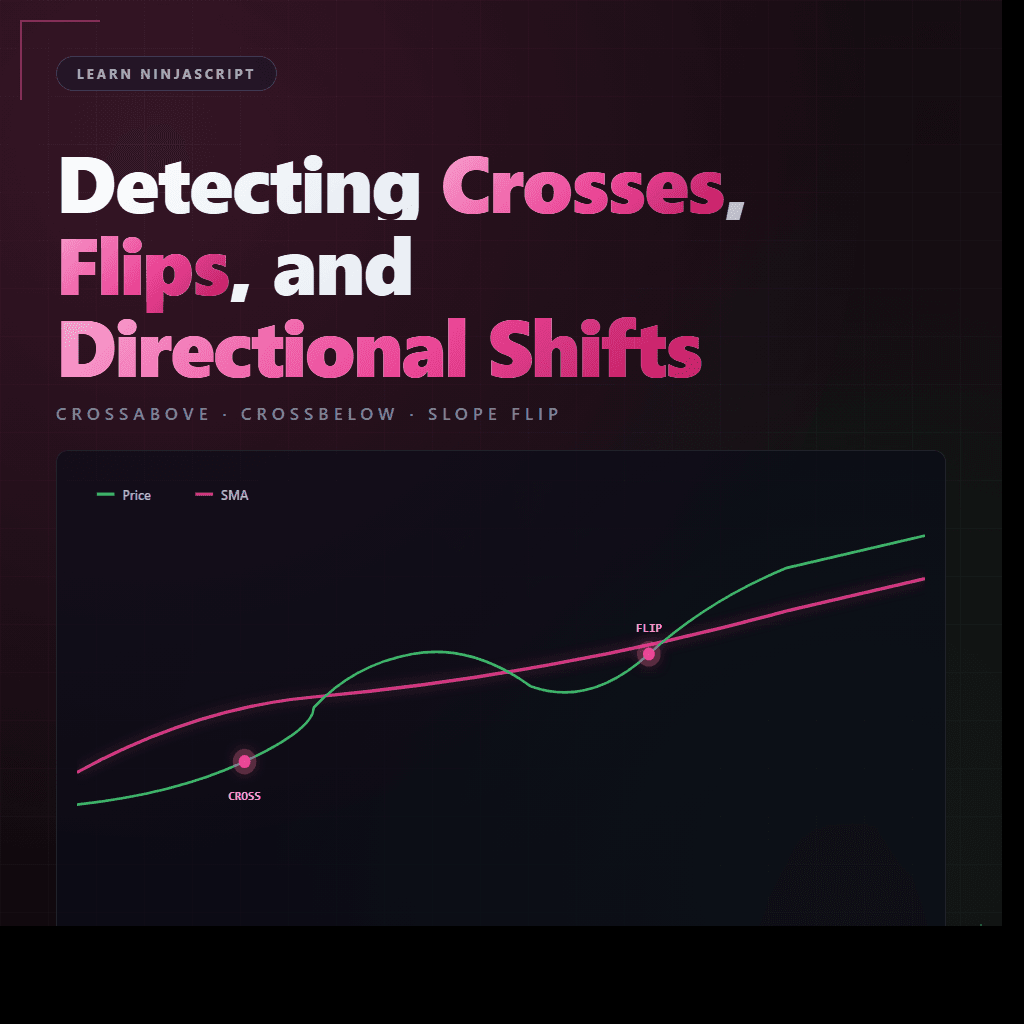
You have an SMA. You want to know when price crosses it — that’s a signal. You also want to know when the SMA itself changes direction — that’s a different signal, same class of problem. Both come down to comparing current and previous values, and NinjaScript has built-in helpers for the common case plus straightforward patterns for the custom one.
This post covers three patterns: CrossAbove / CrossBelow for standard crosses, rolling your own cross detection when the built-ins don’t fit, and the slope-flip and “fire only once” flag patterns that layer on top.
⚙️ CrossAbove and CrossBelow Built-ins
NinjaScript ships two helpers for the most common cross case: one series crossing another. CrossAbove(series1, series2, lookBackPeriod) returns true if series1 crossed above series2 within the last lookBackPeriod bars. CrossBelow is the mirror.
// Fires true on bars where Close crossed above SMA within the last 1 bar.
if (CrossAbove(Close, SMA(Period), 1))
{
    Draw.ArrowUp(this, "cross_" + CurrentBar, false, 0,
                 Low[0] - TickSize * 2, Brushes.LimeGreen);
}
The lookBackPeriod matters. 1 is “crossed on this bar” — what you almost always want for arrow signals. Larger values return true for the full N-bar window after a cross — useful for “recently crossed” logic but prone to multi-firing if you aren’t guarding elsewhere. Default to 1 unless you have a specific reason.
Both helpers accept anything that looks like a price series — Close, High, an indicator like SMA(Period), or a custom Series<double> you built yourself. The pattern scales to “my custom series crossed above another custom series” without writing new code.
🎯 Rolling Your Own Cross Detection
The built-ins expect two series. When one side of the cross is a constant, a computed threshold, or something that isn’t series-shaped, you compare current and previous values directly:
// "Close crossed above 4500" — threshold isn't a series, so we compare manually.
double threshold = 4500;
bool crossedAbove = Close[0] > threshold && Close[1] <= threshold;

if (crossedAbove)
{
    // Fires exactly once, on the bar that crossed.
}
Two things the manual form gets right that you might get wrong if you’re not careful. First, the previous-bar comparison is <=, not < — a bar that touched the threshold exactly doesn’t count as “already above.” Second, the previous bar access [1] requires CurrentBar >= 1; guard with if (CurrentBar < 1) return; or similar at the top of OnBarUpdate.
↕️ Direction-Change Detection
A direction flip on a line — “the SMA was rising, now it’s falling” — isn’t a cross between two series. It’s a change in the sign of the slope. The pattern uses three consecutive values:
if (CurrentBar < Period + 2) return;

double current  = SMA(Period)[0];
double previous = SMA(Period)[1];
double twoBack  = SMA(Period)[2];

bool wasUp  = previous > twoBack;
bool nowUp  = current  > previous;
bool flipped = wasUp != nowUp;
The variable names do the work of documentation here. The flip is simply “was up vs. is up doesn’t match.” You can extend the same pattern to a flatter slope definition — “was rising by at least N ticks per bar” — by comparing (previous - twoBack) against a threshold rather than just checking sign.
🚩 Flip Flag Pattern
The previous section’s flipped is true only on the flip bar. For a strategy or another indicator to read “did a flip happen on this bar or any bar in recent history,” expose it as a Series<bool>:
private Series<bool> sDirectionFlip;

protected override void OnStateChange()
{
    // ... SetDefaults ...
    if (State == State.DataLoaded)
        sDirectionFlip = new Series<bool>(this, MaximumBarsLookBack.Infinite);
}

protected override void OnBarUpdate()
{
    if (CurrentBar < Period + 2) return;

    double current  = SMA(Period)[0];
    double previous = SMA(Period)[1];
    double twoBack  = SMA(Period)[2];

    bool wasUp = previous > twoBack;
    bool nowUp = current  > previous;

    sDirectionFlip[0] = wasUp != nowUp;
}

[Browsable(false)][XmlIgnore]
public Series<bool> DirectionFlip
{
    get { Update(); return sDirectionFlip; }
}
A strategy reading mySma.DirectionFlip[0] gets true only on the bar where direction changed. [3] gives three bars ago. The Series handles the history; your flip-detection code runs once per bar and stores the answer.
Cross Detection Patterns
| What You Are Detecting | Pattern | Notes |
|---|---|---|
| Series crossing another series | CrossAbove(a, b, 1) or CrossBelow(a, b, 1) | Default lookBack of 1. Larger values multi-fire for N bars after a cross. |
| Series crossing a constant or computed threshold | current > threshold && previous <= threshold (manual) | Guard with CurrentBar >= 1 before accessing previous. |
| Line or Series changing direction | Compare slope sign across three consecutive values | Guard with CurrentBar >= Period + 2 to avoid fake flips at chart start. |
| Exposing flip history for strategies |
Write the flip bool into a Series | Use MaximumBarsLookBack.Infinite; mark [Browsable(false)][XmlIgnore]. |
📝 Pitfalls Checklist
- Using
==on floating-point values.Close[0] == SMA[0]is almost never true in practice. Always use the cross comparison pattern (strict current, inclusive previous). - Forgetting the
lookBackPeriodonCrossAbove/CrossBelow. Values greater than 1 returntruefor multiple bars after a cross. Use1unless you want multi-fire behavior. - Triggering on every bar of sustained direction. If you wrote
if (Close[0] > SMA[0])thinking it was a cross, you got every bar above the SMA, not just the cross bar. The cross form requires BOTHcurrent aboveANDprevious at or below. - Not guarding
Value[1]orSeries[1]access. At bar 0 there is no previous bar. Guard withif (CurrentBar < 1) return;before any bars-ago-1 access. - Using
CrossAbovewith a Series that resets bars. Reset bars on aSeries<double>are technically “invalid data.” IfCrossAbovereads across a reset boundary, the result depends on how the helper treats invalid slots. Test with your own cross-detection pattern for full control. - Slope flip fired on the first plot bar. The two-back comparison needs
CurrentBar >= Period + 2. Without that guard you get a fake flip at the start of the chart.