TradingView Liquidity Flow Surge Profile [ChartPrime] Conversion to NinjaTrader 8
ChartPrime’s Liquidity Flow Surge Profile takes the volume-profile concept and renders it as a flowing thermal heatmap on the price panel. Twenty-five bins span the lookback’s price range; each bar’s volume is attributed to the bin its close falls into; bin opacity scales with volume share. The hottest bins glow; the coldest fade out below a sensitivity floor.
On top of the heatmap, the indicator runs a liquidation-surge engine. When the current bar’s volume relative to its 500-bar peak exceeds 40%, a labeled surge bubble drops above (Short Liquidation, on bull bars) or below (Long Liquidation, on bear bars). Bubble size and opacity scale with the relative-volume bucket. A 2 × 2 SharpDX dashboard top-right tracks the most recent surge.
This post is the NinjaTrader 8 conversion. The full source compiles standalone in indTradingView/, renders the heatmap and bubbles directly on the price panel, and is yours to download as a NinjaScript Archive.
Original Pine Script: Liquidity Flow Surge Profile by ChartPrime
License: Mozilla Public License 2.0 (MPL 2.0)
🆚 What Makes Liquidity Flow Surge Profile Different
Standard volume profile is a static histogram on the side of the chart. Useful, but it says nothing about when volume happened — only how much hit each level. Liquidity Flow Surge Profile is dynamic: each bar carries its own profile snapshot, so the heatmap actually flows with history. Recent volume hot zones glow brightly; older zones cool off, with the visible heatmap reflecting the actual time-evolution of the volume distribution.
Profile depth as a regime selector. Short = 150 bars, Medium = 350, Long = 700. Each represents a different liquidity-context window — short for intraday, long for swing-context.
Liquidation surges, not just volume spikes. The surge engine doesn’t fire on every high-volume bar — it fires on bars where volume / 500-bar high ≥ 0.4, paired with a Short Liquidation label on bull bars and a Long Liquidation label on bear bars. The interpretation is asymmetric: a sharp bull bar with surge volume isn’t ‘buyers buying’ — it’s ‘shorts being liquidated.’ The label naming reflects that.
Quantized-alpha palette. The heatmap uses a 21-bucket pre-computed alpha brush palette so per-bar rendering doesn’t allocate ~12,500 brushes per frame across the visible window. The visual is identical to a continuously-shaded heatmap; the cost is a fixed 21-brush table built once per render-target lifecycle.
⚙️ Settings
Liquidity Flow Surge Profile exposes its inputs in three property groups: the Profile (depth + base color), the Liquidation Bubbles (toggle + Short / Long colors), and the Dashboard (toggle + label text size).
Profile
| Parameter | Default | Description |
|---|---|---|
| Profile Depth | Long | Lookback for the volume profile: Short=150, Medium=350, Long=700 bars. |
| Structural Liquidity Color | #6B7B8F | Base color for the profile bins. Intensity scales with volume share. |
Liquidation Bubbles
| Parameter | Default | Description |
|---|---|---|
| Show Bubbles | True | Render volume-surge labels above / below candles when surge fires. |
| Short Liquidation Color | #00FFBB | Color for surges on bull bars (label drawn above the high). |
| Long Liquidation Color | #FF0055 | Color for surges on bear bars (label drawn below the low). |
Dashboard
| Parameter | Default | Description |
|---|---|---|
| Show Dashboard | True | Render the latest-liquidation HUD top-right. |
| Label Text Size | Normal | Text size for the dashboard. Bubble labels scale separately by relative volume. |
🧠 How It Works
Each bar runs the volume-profile binning, the per-bar profile snapshot, and the surge-engine evaluation.
- Lookback window. Map ProfileDepth → window: Short=150, Medium=350, Long=700. Highest-high and lowest-low across the window define the bin range. Bin height = (high − low) / 25.
- Volume binning. For each bar in the lookback, find the bin its close falls into and add the bar’s volume to that bin’s accumulator. Highest-volume bin = POC.
- Per-bar snapshot. The current bar’s priceHigh / priceLow / 25 bin intensities are written to
Series<double>snapshots so the heatmap can flow with history. Without snapshots, the live bar’s profile would paint across all visible bars (Pine’s default, but visually misleading). - Heatmap render. For each visible bar j, look up the snapshot, then for each bin paint a SharpDX
FillRectanglespanning the bin’s price range and one bar’s pixel width. Brush is selected from a 21-bucket alpha palette by intensity = binVolume / maxBinVolume. Bins below sensitivity 0.5 use the lowest-alpha bucket — ‘cold zones.’ - Surge engine. Compute relativeVolume = currentVolume / max(volume, 500-bar). If ≥ 0.4, fire a surge. Bull bar (close > open) → ‘Short Liquidation’ label above the high. Bear bar → ‘Long Liquidation’ below the low.
- Bubble sizing. Bubble label font size and opacity bucket scale with the relative-volume value, so a 0.4 surge prints as a small faint label and a 0.95 surge prints as a large saturated one.
- Dashboard. Top-right 2 × 2 SharpDX HUD shows the most recent surge type and its volume. Refreshes only on a new surge.
The indicator is non-repainting: profile binning and surge detection both use closed-bar volume only. The current-bar ‘near’ bin is rendered transparent so the live candle isn’t obscured by the heatmap.
🛠️ Using It in a Strategy
Liquidity Flow Surge Profile is a chart-decoration indicator — it renders heatmap + bubbles + HUD but exposes no Series<> outputs. A strategy that wants to fade liquidation surges (the canonical use case — surges often mark short-term exhaustion) runs the same volume / 500-bar-high check independently. Keep the indicator on the chart for the visual confirmation while the strategy acts on the same primitive.
Below is the lifecycle: instantiate MAX(Volume, 500) in State.DataLoaded, then in OnBarUpdate watch for the surge condition.
private LiquidityFlowSurgeProfile lfsp;
private MAX vol500;

protected override void OnStateChange()
{
    if (State == State.SetDefaults)
    {
        Name = "LiquidityFlowSurgeProfileStrategyExample";
    }
    else if (State == State.DataLoaded)
    {
        // Visual companion only.
        lfsp = LiquidityFlowSurgeProfile(
            LiquidityFlowSurgeProfile_Depth.Long,
            true,
            true,
            LiquidityFlowSurgeProfile_TextSize.Normal
        );

        // Strategy-side surge detector — same threshold the indicator uses.
        vol500 = MAX(Volume, 500);
    }
}

protected override void OnBarUpdate()
{
    if (CurrentBar < 510) return;

    double relativeVolume = vol500[0] > 0 ? Volume[0] / vol500[0] : 0.0;
    bool surge = relativeVolume >= 0.4;
    if (!surge) return;

    bool bullBar = Close[0] > Open[0];
    bool bearBar = Close[0] < Open[0];

    // Fade the surge: liquidation often marks short-term exhaustion.
    if (bearBar && Position.MarketPosition != MarketPosition.Long)  EnterLong();
    if (bullBar && Position.MarketPosition != MarketPosition.Short) EnterShort();
}
The example below fades the surge: bear-bar Long Liquidation = enter long, bull-bar Short Liquidation = enter short. Use it in a stand-alone strategy or layer it on top of a trend-filter signal.
Public Outputs
| Output | Type | Description |
|---|---|---|
| — | — | Liquidity Flow Surge Profile is a chart-decoration indicator — heatmap + bubbles + HUD without Series outputs. A strategy that wants to act on surge events runs the same volume-vs-500-bar-high check independently — see the example below. |
🔄 Conversion Notes
A few things changed in the translation from Pine Script to NinjaScript:
Per-bar profile snapshots. Pine’s plot()-based profile renders the latest bar’s profile across the entire visible window — visually misleading because the historical profile actually evolves bar-by-bar. The conversion stores priceLow / priceHigh / 25-bin intensity per bar in Series<double> snapshots so the heatmap genuinely flows with history.
Quantized 21-bucket alpha palette. A continuous-alpha render would allocate roughly 12,500 brushes per frame across the visible window (500 bars × 25 bins). The conversion pre-builds 21 alpha buckets in 0.05 increments at render-target setup and indexes into them by intensity — same visual, fixed allocation cost.
SharpDX FillRectangle per visible bin. Pine’s 25 stacked-fill plots are replaced with one SharpDX FillRectangle per bin per visible bar in OnRender. Cleaner geometry, fewer plots, and the heatmap can use the per-bar snapshot above without needing 25 separate Series<double> on the plot stack.
Bubble sizing via SharpDX TextFormat. Pine’s label.size family (size.tiny, size.small, etc.) maps to a SharpDX TextFormat sized by the relative-volume bucket. Five buckets, five fonts, all built once per text-size change.
Dashboard via SharpDX HUD. Pine’s table with the most-recent-liquidation summary becomes a 2 × 2 SharpDX HUD at top-right. Cell brushes follow the bubble-color setting so the dashboard color matches the most recent surge.
📦 Download
The full source is available as a free NinjaScript Archive. To install:
- Download the
.zipfile below. - In NinjaTrader 8, go to Tools → Import → NinjaScript Add-On.
- Select the downloaded
.zipfile. - The indicator will appear under Indicators → indTradingView → Liquidity Flow Surge Profile [ChartPrime] on your chart.
📊 Chart Example
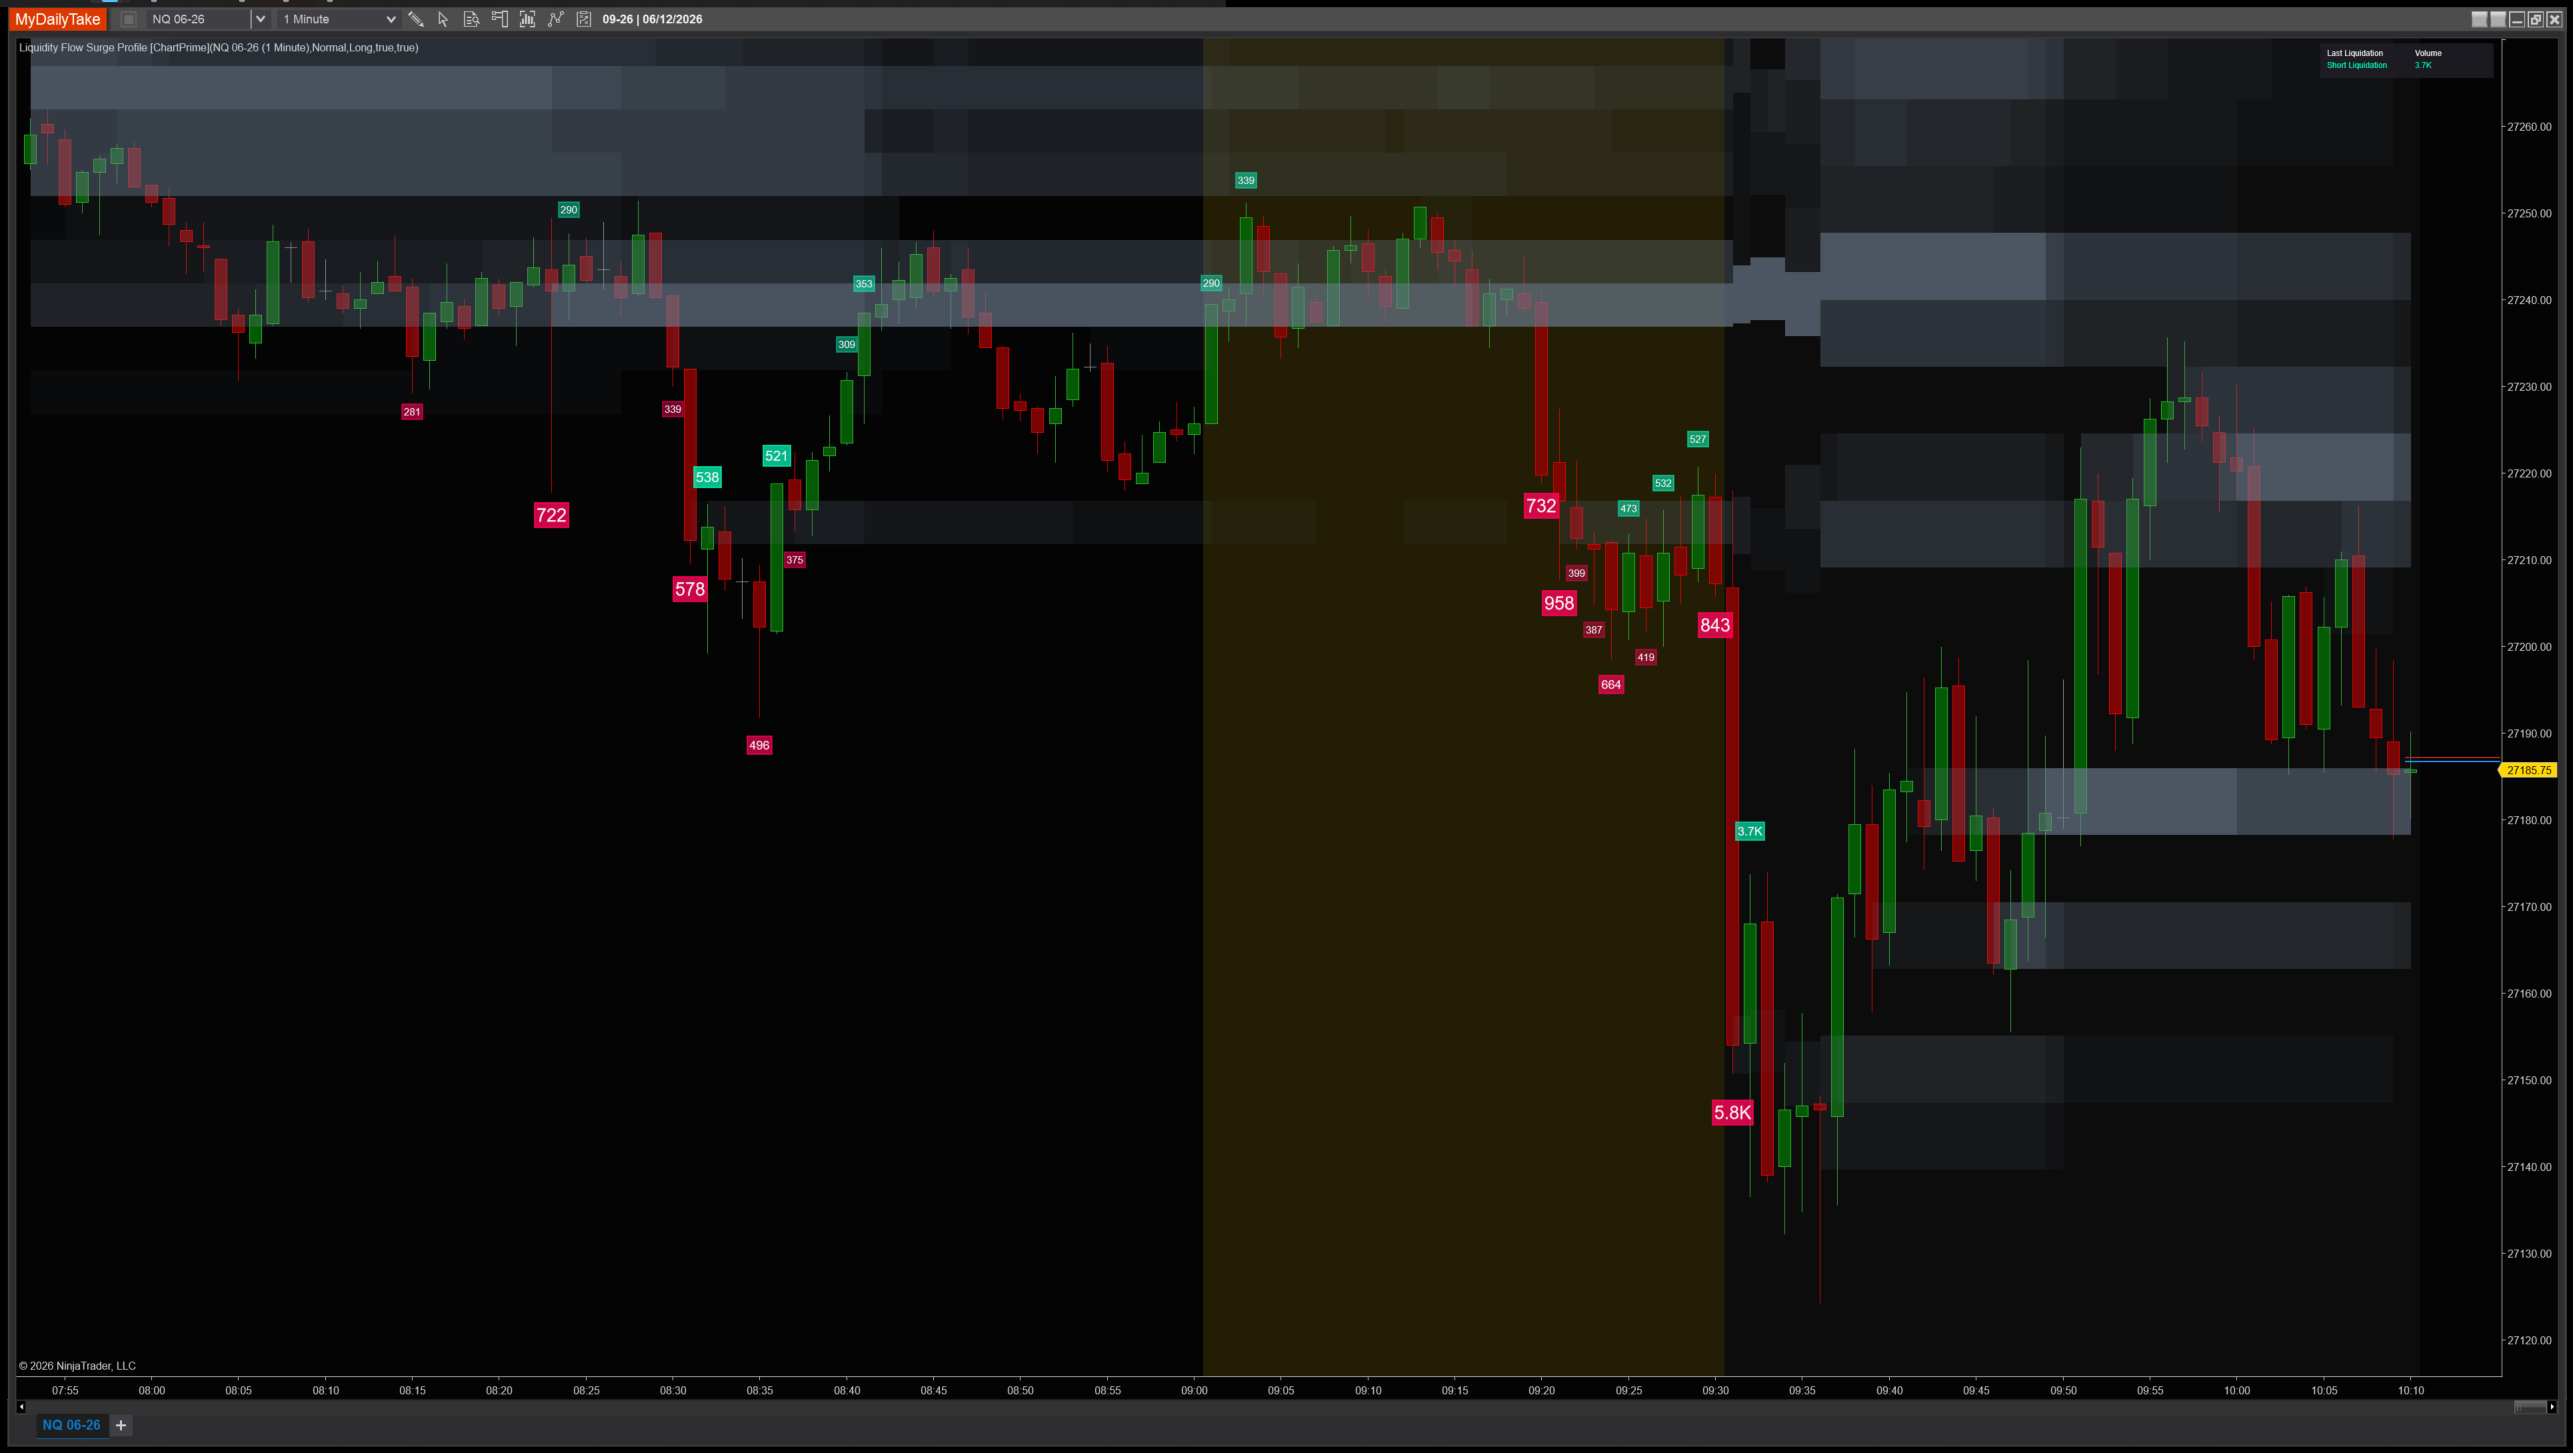
Liquidity Flow Surge Profile on a 1-minute chart with default settings (Long depth = 700 bars). The 25-bin volume heatmap glows brightly at high-volume price levels and fades through cold zones. Liquidation surge bubbles drop above bull bars and below bear bars when relative volume exceeds 40% of the 500-bar peak. The top-right HUD shows the most recent surge type and volume.


The original Pine Script™ code is by ChartPrime and is licensed under the Mozilla Public License 2.0 (MPL 2.0). This NinjaTrader 8 adaptation is by MyDailyTake.com. The use of ChartPrime’s name or adapted code does not imply endorsement by the original author.