The Darvas Box Breakout Indicator for NinjaTrader 8
In 1956 Nicolas Darvas was a 35-year-old ballroom dancer touring the world. He didn’t have a Bloomberg terminal, a screener, a chat room, or electronic trading charts. He had cabled stock quotes sent to his hotels in Tokyo, Saigon, and Hong Kong, and a few notebooks. By 1958 he had turned about $36,000 into more than $2 million — and his 1960 book How I Made $2,000,000 in the Stock Market became one of the most influential retail-trading books ever written.
The system he came up with — what he called Box Theory — is what this indicator implements for NinjaTrader 8. Stocks moved in “boxes,” he said. A high price would print, then 3 days later if it still hadn’t been exceeded, that high was the top of the box. After that, a low would print and 3 days later if it still hadn’t been broken — that was the bottom. Now you had a rectangle. Darvas placed a buy stop just above the top and a protective stop just below the bottom. When the breakout fired, he was in. When the next box formed above, he added. When the bottom of the current box broke, he was out. Simple, mechanical, and ruthless about losers.
🧠 How the Darvas Box Forms
Our indicator implements Darvas’s two-stage detection exactly as the book describes it:
- Top locks. A new highest high prints. We then count consecutive bars without a higher high. Once that count hits
Confirmation Days(Darvas canonical = 3), the top is locked. - Bottom locks. Once the top is locked, we look for the lowest low since that top. We count consecutive bars without a lower low. Once that count hits
Confirmation Days, the bottom is locked. - Box is armed. With both sides confirmed, the box is now a fixed rectangle (gold by default) and we’re watching for breakout in either direction.
- Breakout fires. If price breaks above the top, the box is recorded as broken-up (green) and a long signal fires. If price breaks below the bottom, the box is recorded as broken-down (red) and a short signal fires. Either way, a fresh box-search starts immediately at the breakout bar — that’s the “stacked boxes” pattern Darvas described.
If price makes a new higher high while the bottom is still being searched for, the entire process resets — that high becomes the new top candidate. The box wasn’t valid yet, so there’s nothing to retire.
📊 Reading the Chart
Boxes are color-coded by state, and that’s the fastest way to read what the indicator is showing you:
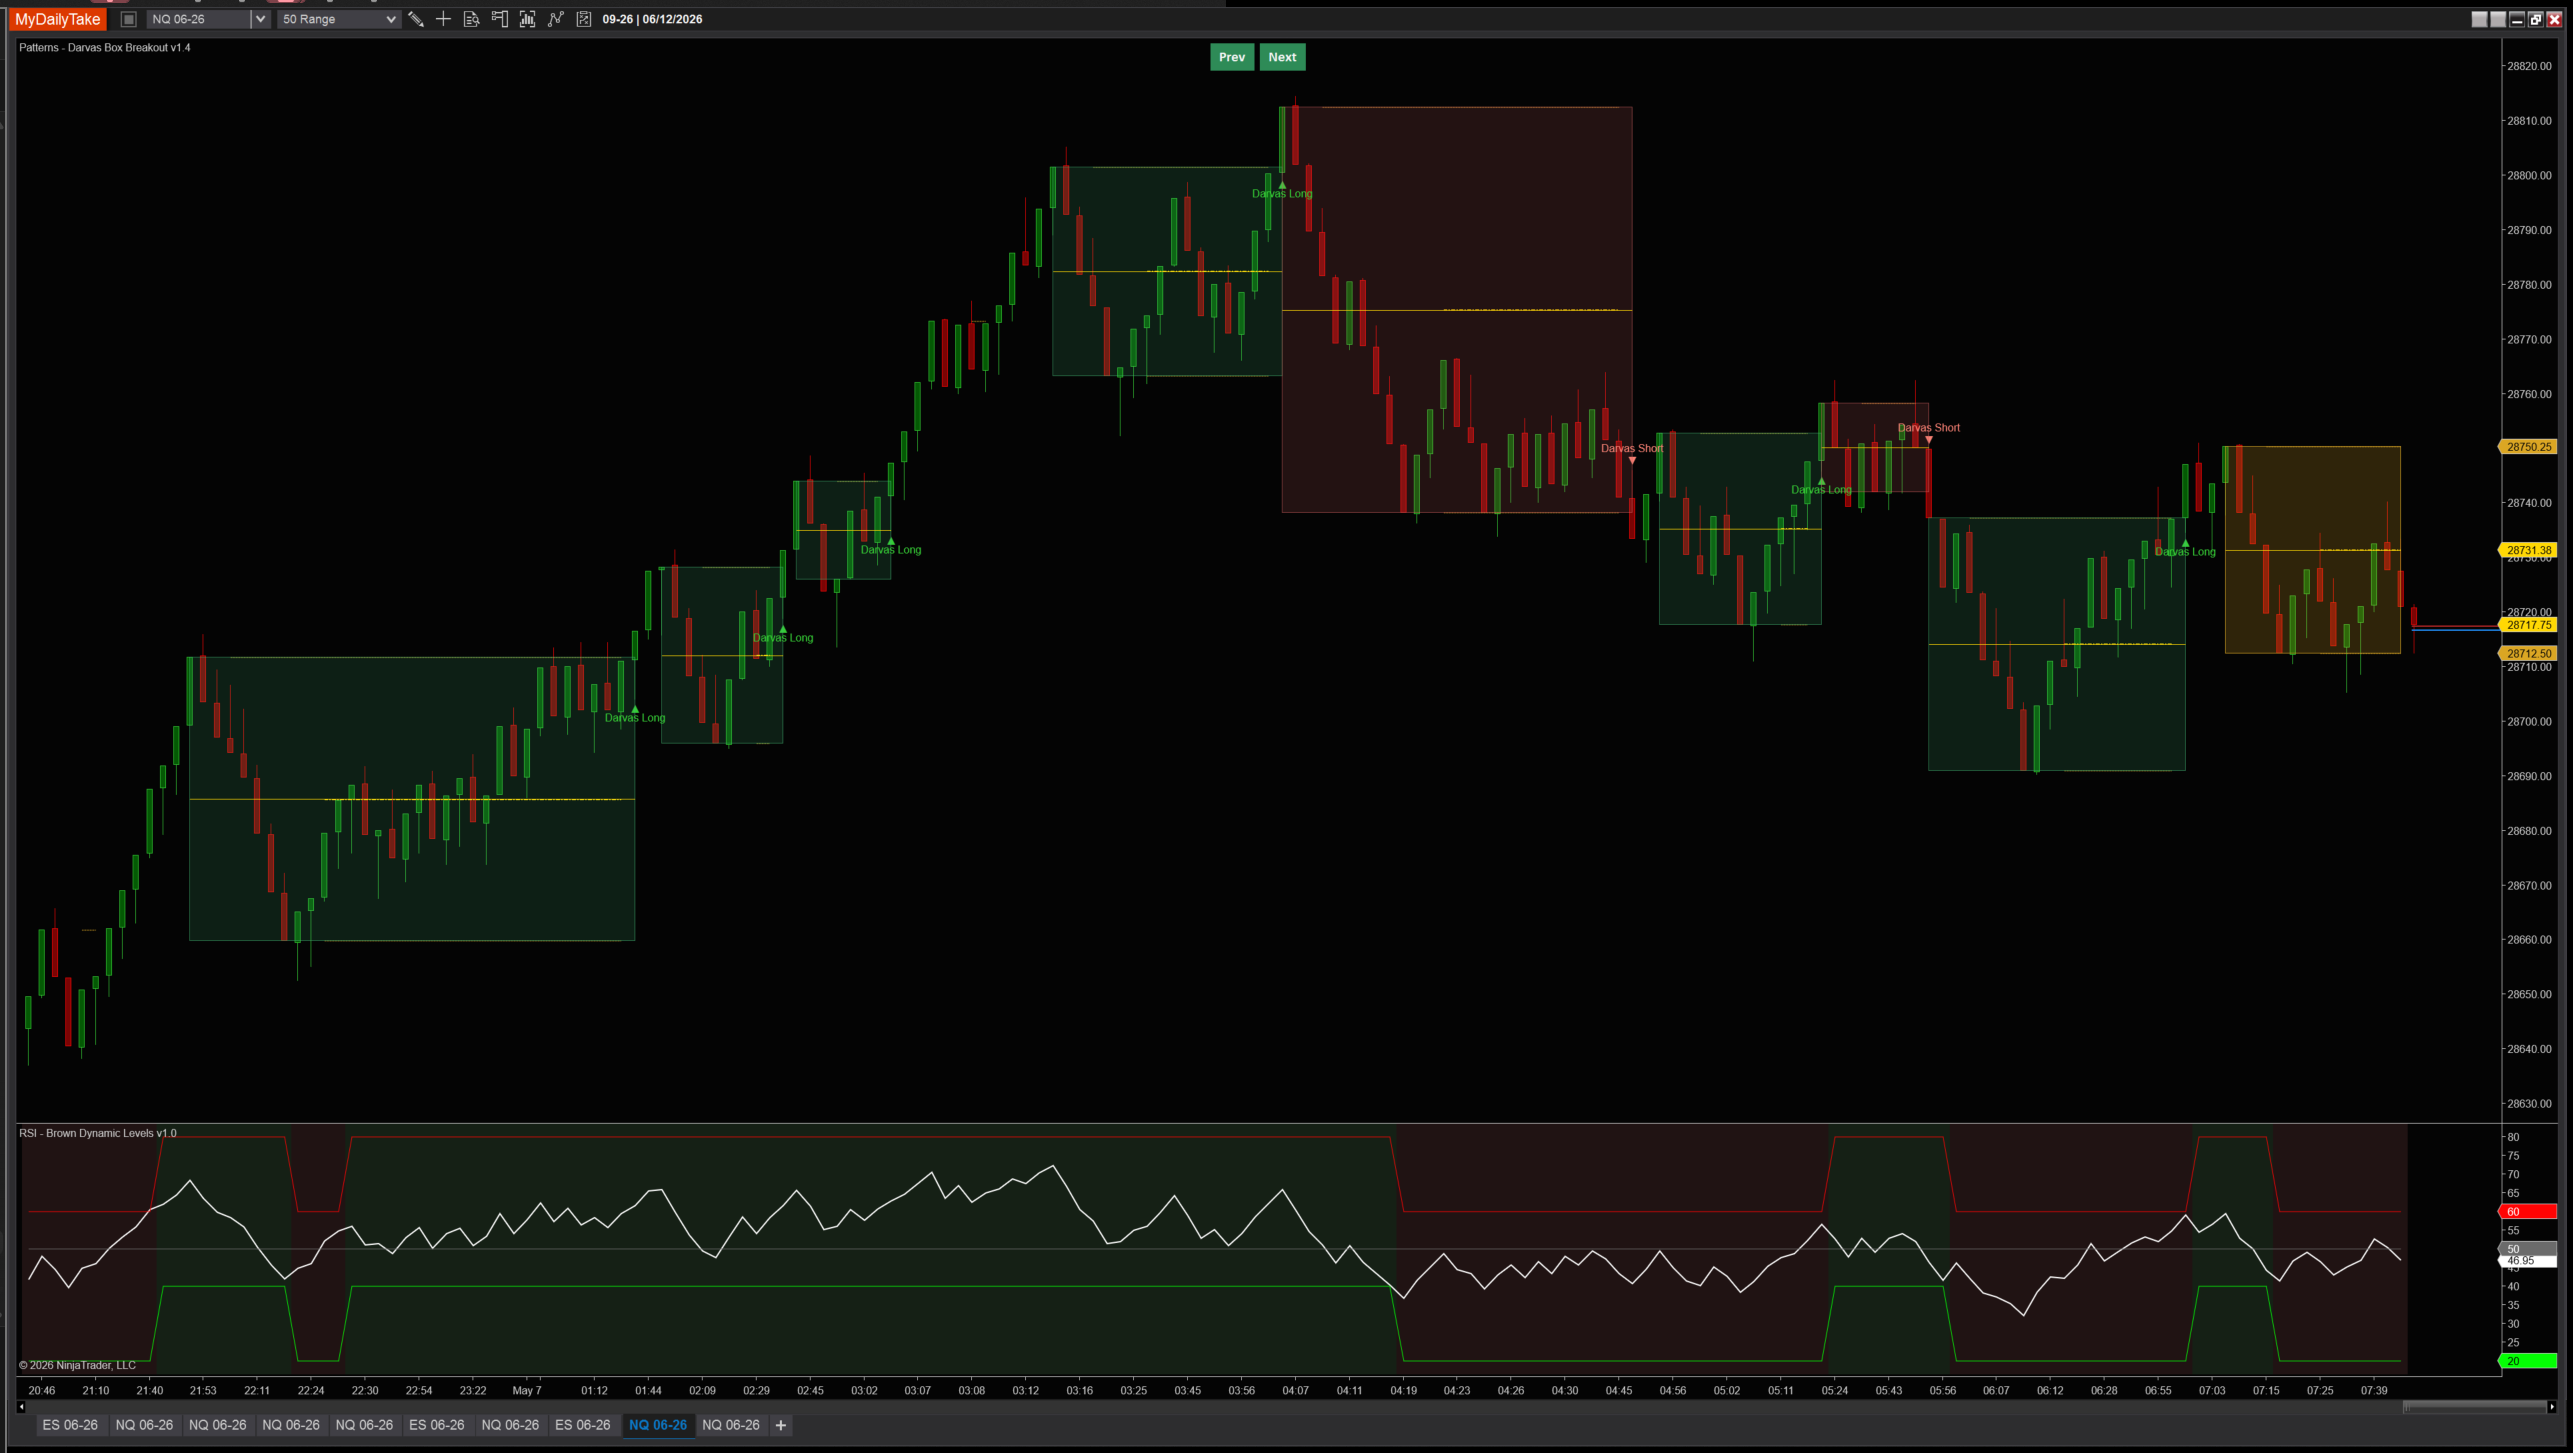
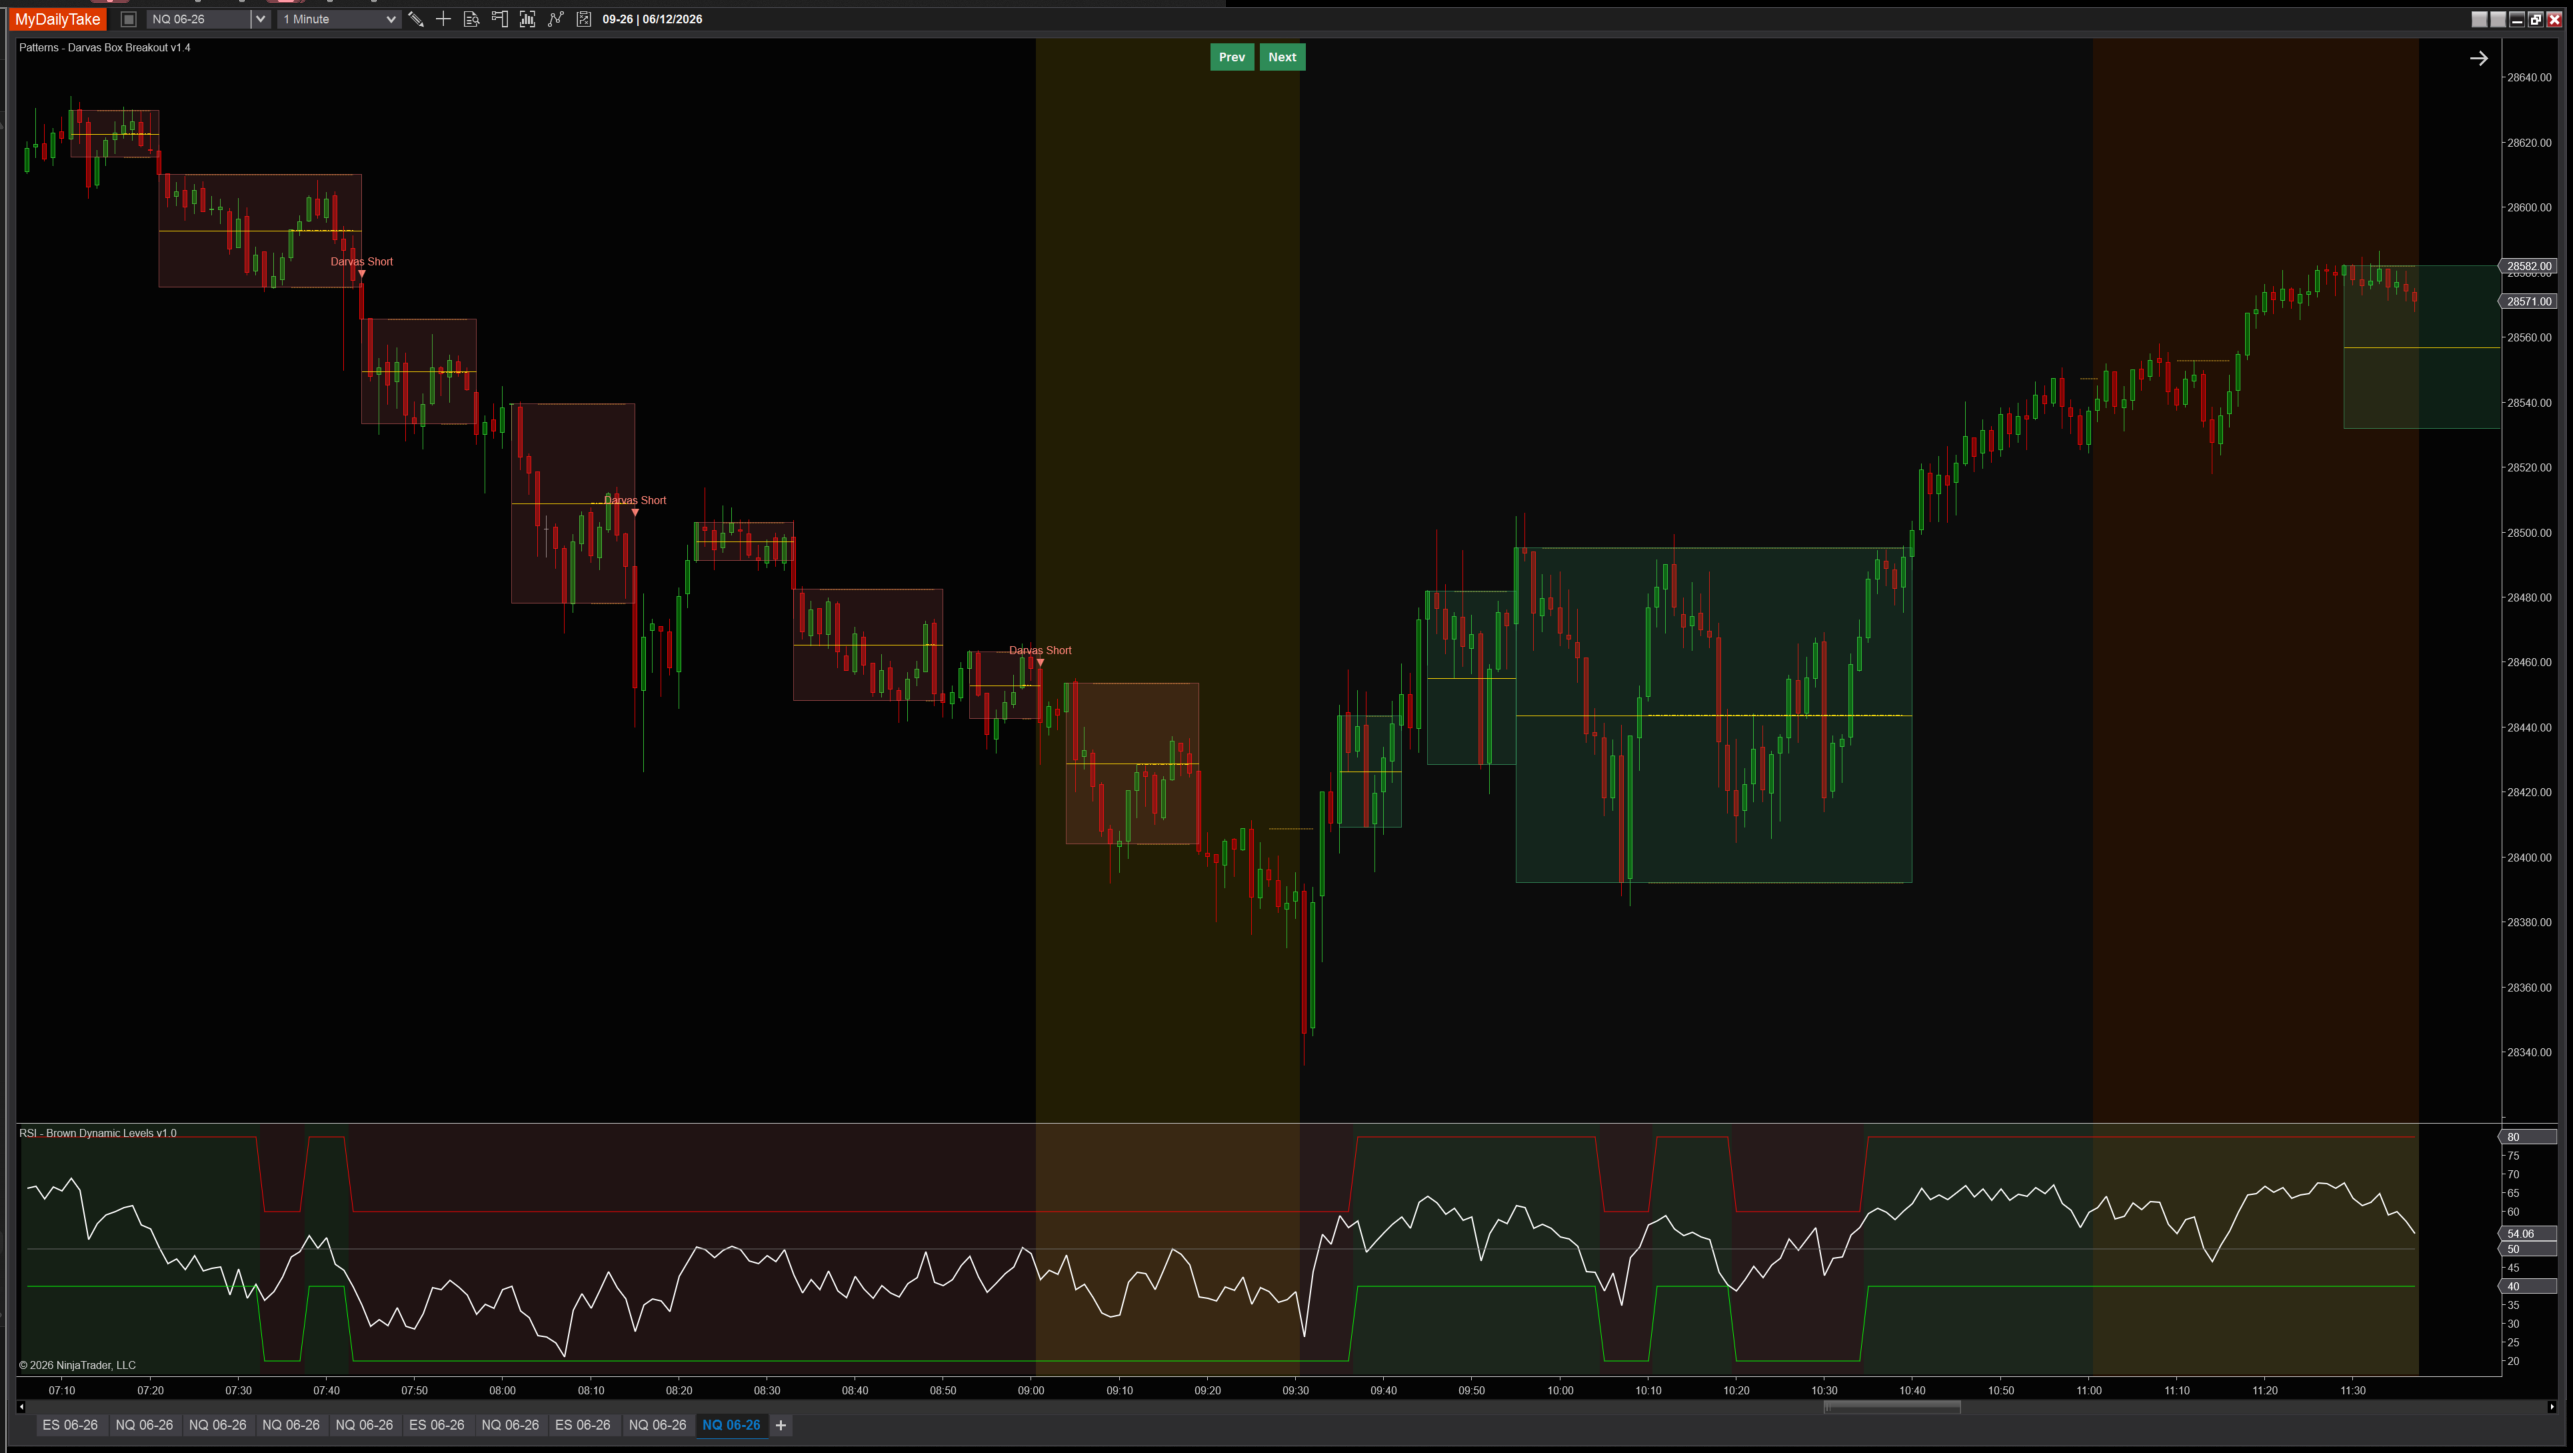
- Gold rectangle — currently armed, watching for breakout.
- Green rectangle with a triangle below — broken upward, long signal fired on that bar.
- Red rectangle with a triangle above — broken downward, short signal fired on that bar.
- Yellow horizontal line through every box — the 50% midline, a frequent intra-box reference level. Optional.
- Dashed horizontal lines at the current armed box’s top and bottom — these track in real time as a new box forms.
The screenshot below shows a textbook stacked-box uptrend on NQ: four green broken-up boxes climbing the chart, each one’s breakout becoming the launching point for the next, with the current armed box (gold, on the right) waiting for its own breakout decision.
🔄 Up Trends, Down Trends, and Regime Changes
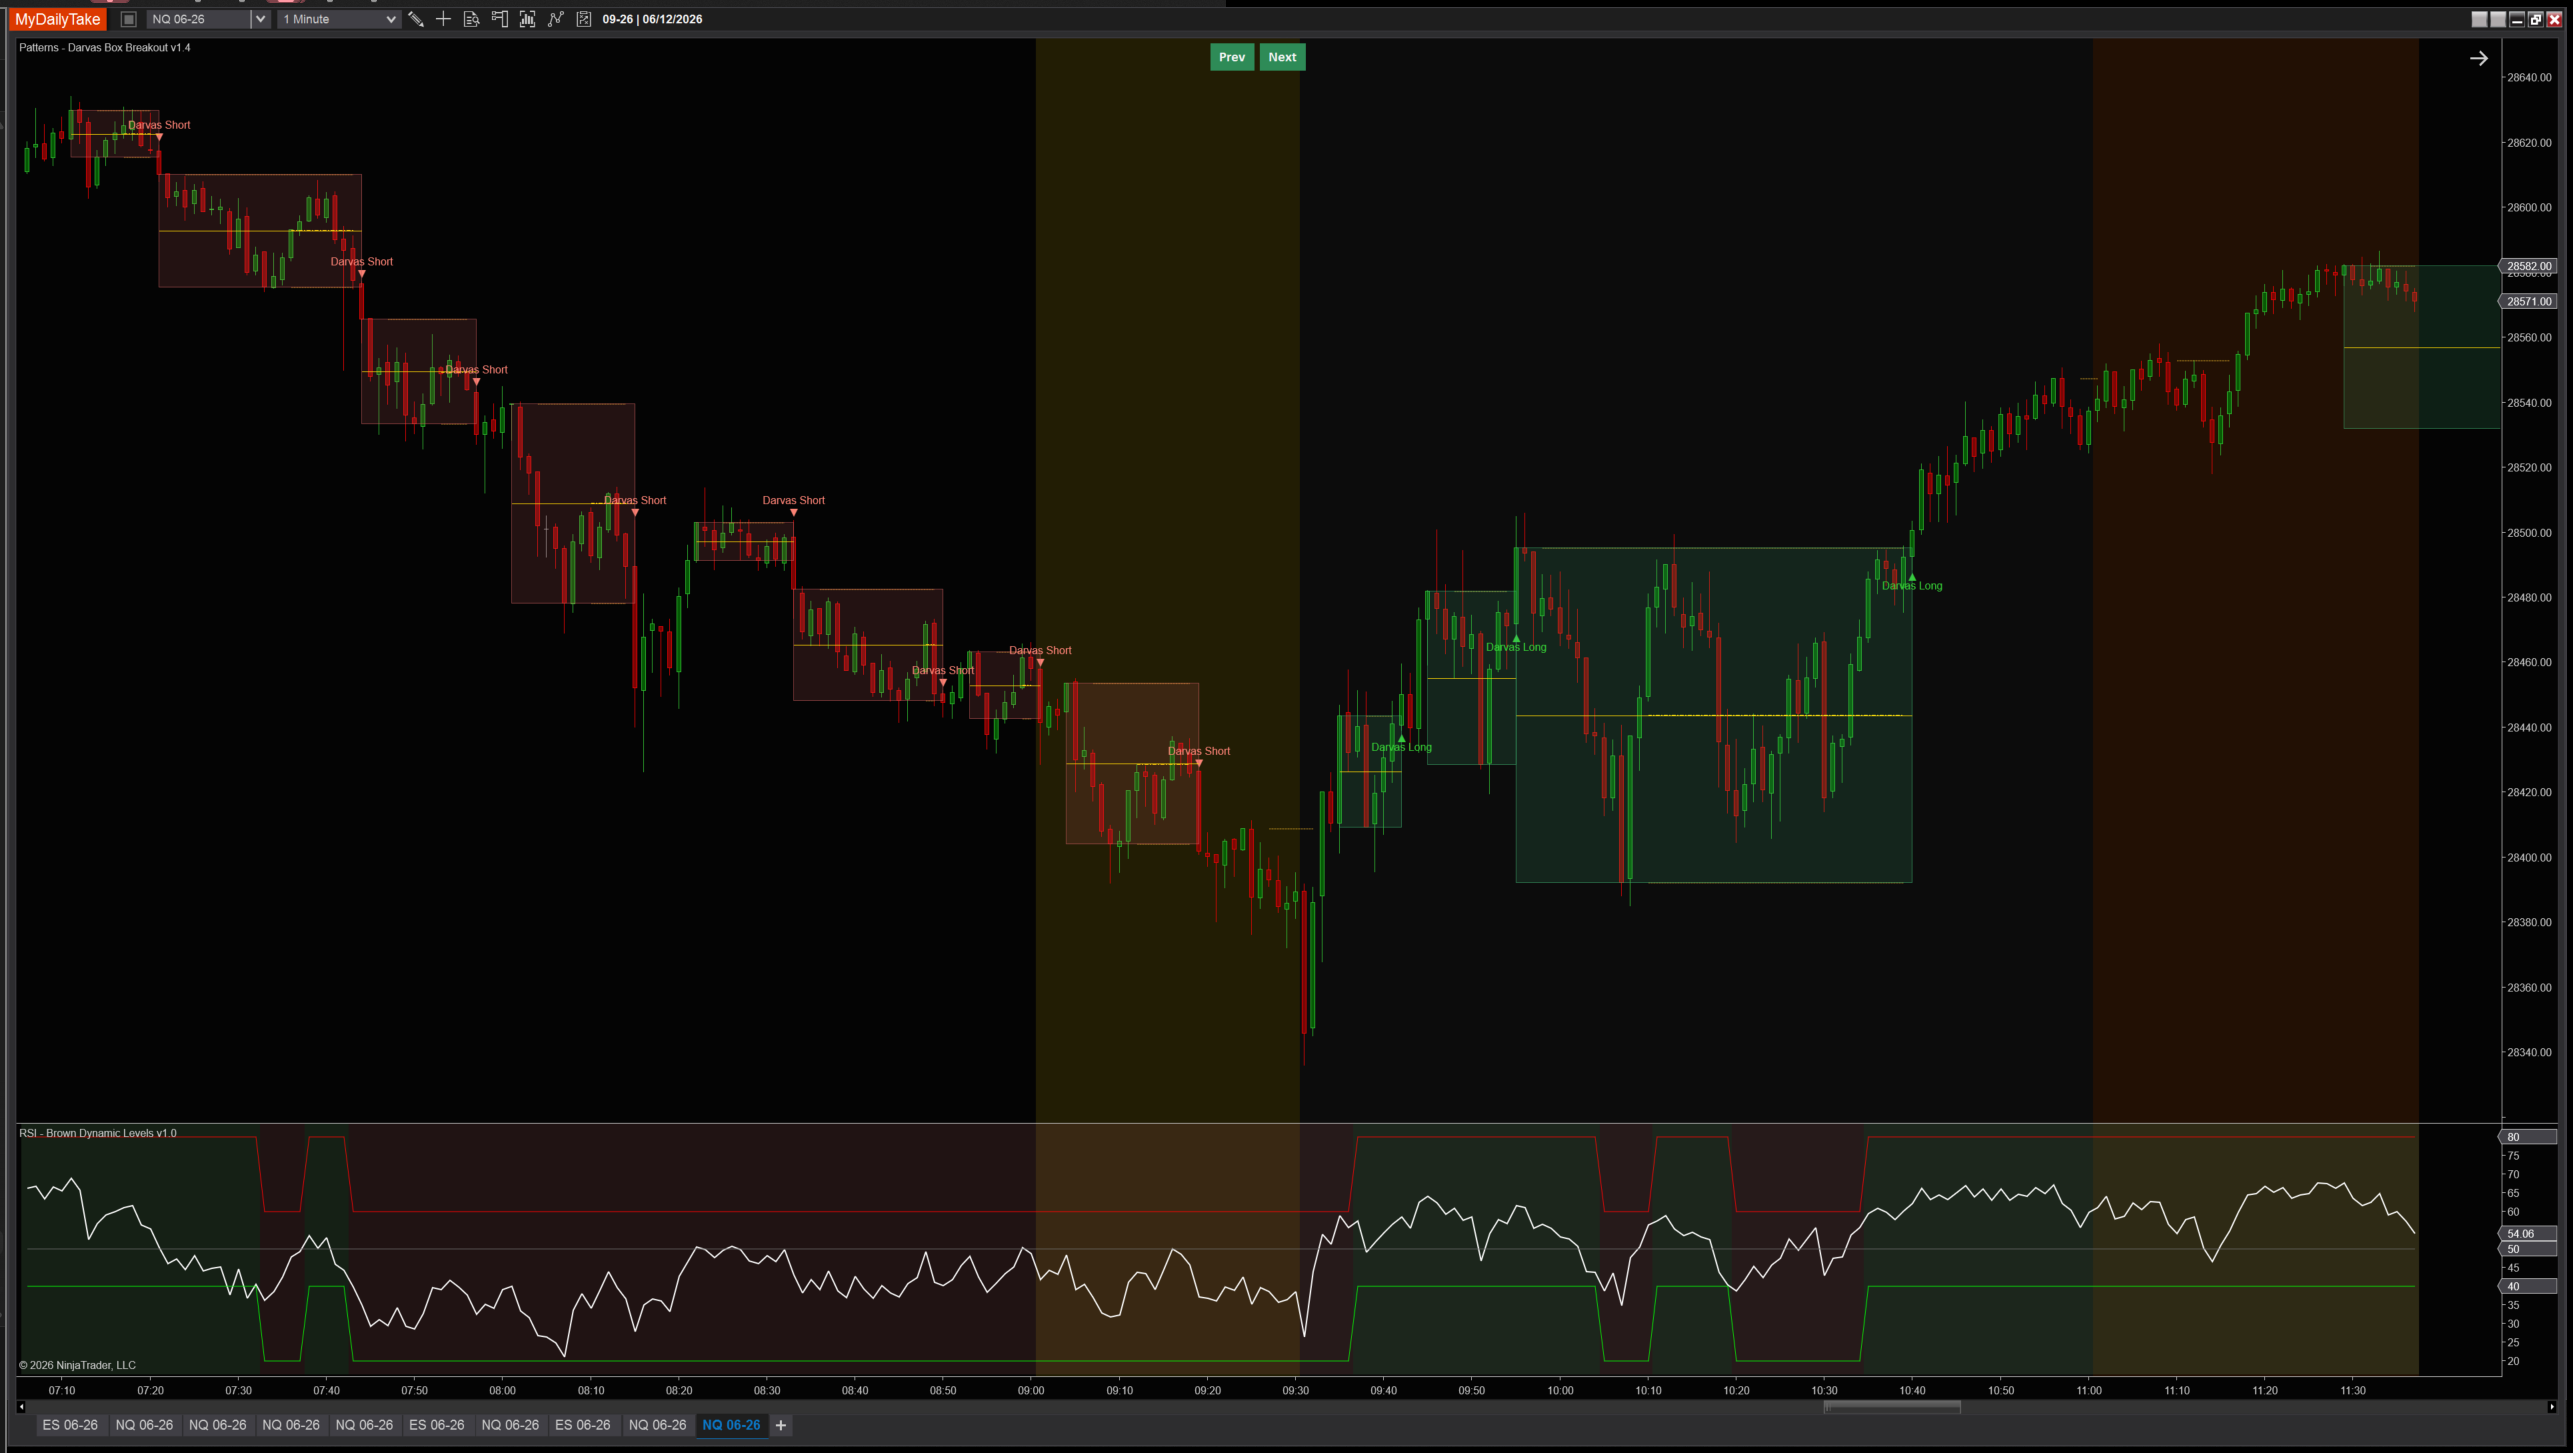
Darvas himself was strictly long-only — he traded stocks in bull markets and used a downside break of his current box as the stop-out signal, not as a short trigger. This indicator gives you both directions. The book purist can disable Show Short Breakdowns, but on futures the symmetric short signals tend to be useful: a stack of red boxes telegraphs a sustained downtrend just as cleanly as the upside version, and the regime change between them is something you can see rather than infer.
📈 Combining With a Trend Filter
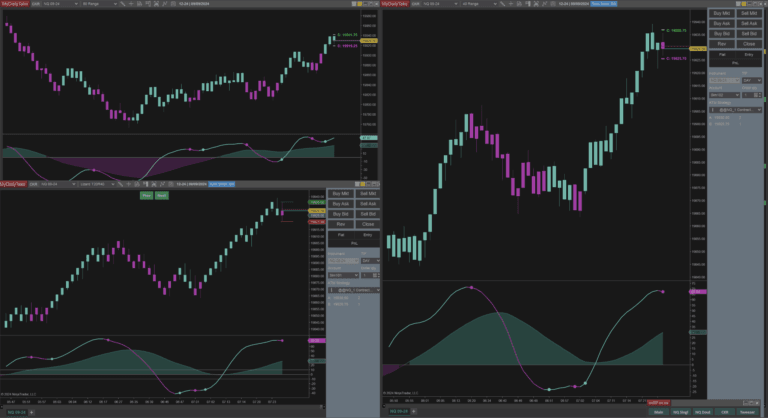
One of the cleanest uses of the indicator is as the signal half of a two-step setup: Darvas tells you when the box breaks, a separate indicator tells you whether the regime supports taking the trade. The chart screenshots above include an RSI panel for exactly that reason — it’s a quick visual filter for which side of the breakout to favor.
A simple version of that filter in code: take long breakouts only when RSI is above 50, take short breakdowns only when RSI is below 50. The indicator’s public Series outputs make this wiring trivial.
private RSI							rsi;
private PatternsDarvasBoxBreakout	darvas;

protected override void OnStateChange()
{
    if (State == State.SetDefaults)
    {
        Name		= "DarvasRsiTrendFilter";
        Calculate	= Calculate.OnBarClose;
    }
    else if (State == State.DataLoaded)
    {
        rsi    = RSI(14, 3);
        darvas = PatternsDarvasBoxBreakout(
            showLong:                  true,
            showShort:                 true,
            confirmationDays:          3,
            breakoutBasis:             PatternsDarvasBoxBreakout_BreakoutBasis.Close,
            requireVolumeConfirmation: true,
            volumeAvgPeriod:           20,
            volumeMultiplier:          1.5);
    }
}

protected override void OnBarUpdate()
{
    if (CurrentBar < 50) return;

    // Long breakout above the box top, only if RSI confirms uptrend
    if (darvas.IsLongBreakoutSeries[0] && rsi[0] > 50)
        EnterLong("Darvas Long");

    // Short breakdown below the box bottom, only if RSI confirms downtrend
    if (darvas.IsShortBreakdownSeries[0] && rsi[0] < 50)
        EnterShort("Darvas Short");
}
The same wiring works with any trend gauge — ADX, a 200-MA slope, the Squeeze, your own custom regime indicator. Every signal-relevant value is exposed as a Series<T> so historical lookback (e.g. darvas.BoxTopSeries[5]) works.
Public Outputs
| Output | Type | Purpose |
|---|---|---|
| IsLongBreakoutSeries |
Series | True on the bar a long breakout fires. |
| IsShortBreakdownSeries |
Series | True on the bar a short breakdown fires. |
| BoxTopSeries |
Series | Live top of the current armed (or in-progress) box. |
| BoxBottomSeries |
Series | Live bottom of the current armed box. |
| BoxMidlineSeries |
Series | 50% midline of the current armed box. |
| BoxArmedSeries |
Series | True while a box is armed and watching for breakout. |
🛡️ Volume Confirmation
Darvas put a lot of weight on volume on the breakout day. A box top that broke on light volume was, in his words, “suspicious” — he often saw price retreat right back into the range. The indicator implements this as an optional gate: when Require Volume Confirmation is on, a breakout bar only fires its long/short signal if its volume meets or exceeds Volume Multiplier times the prior Volume Average Period-bar average.
With volume confirmation engaged, the chart cleans up significantly — only signal-confirmed boxes render by default. Volume-rejected breakouts are filtered out of the visual signal stream:
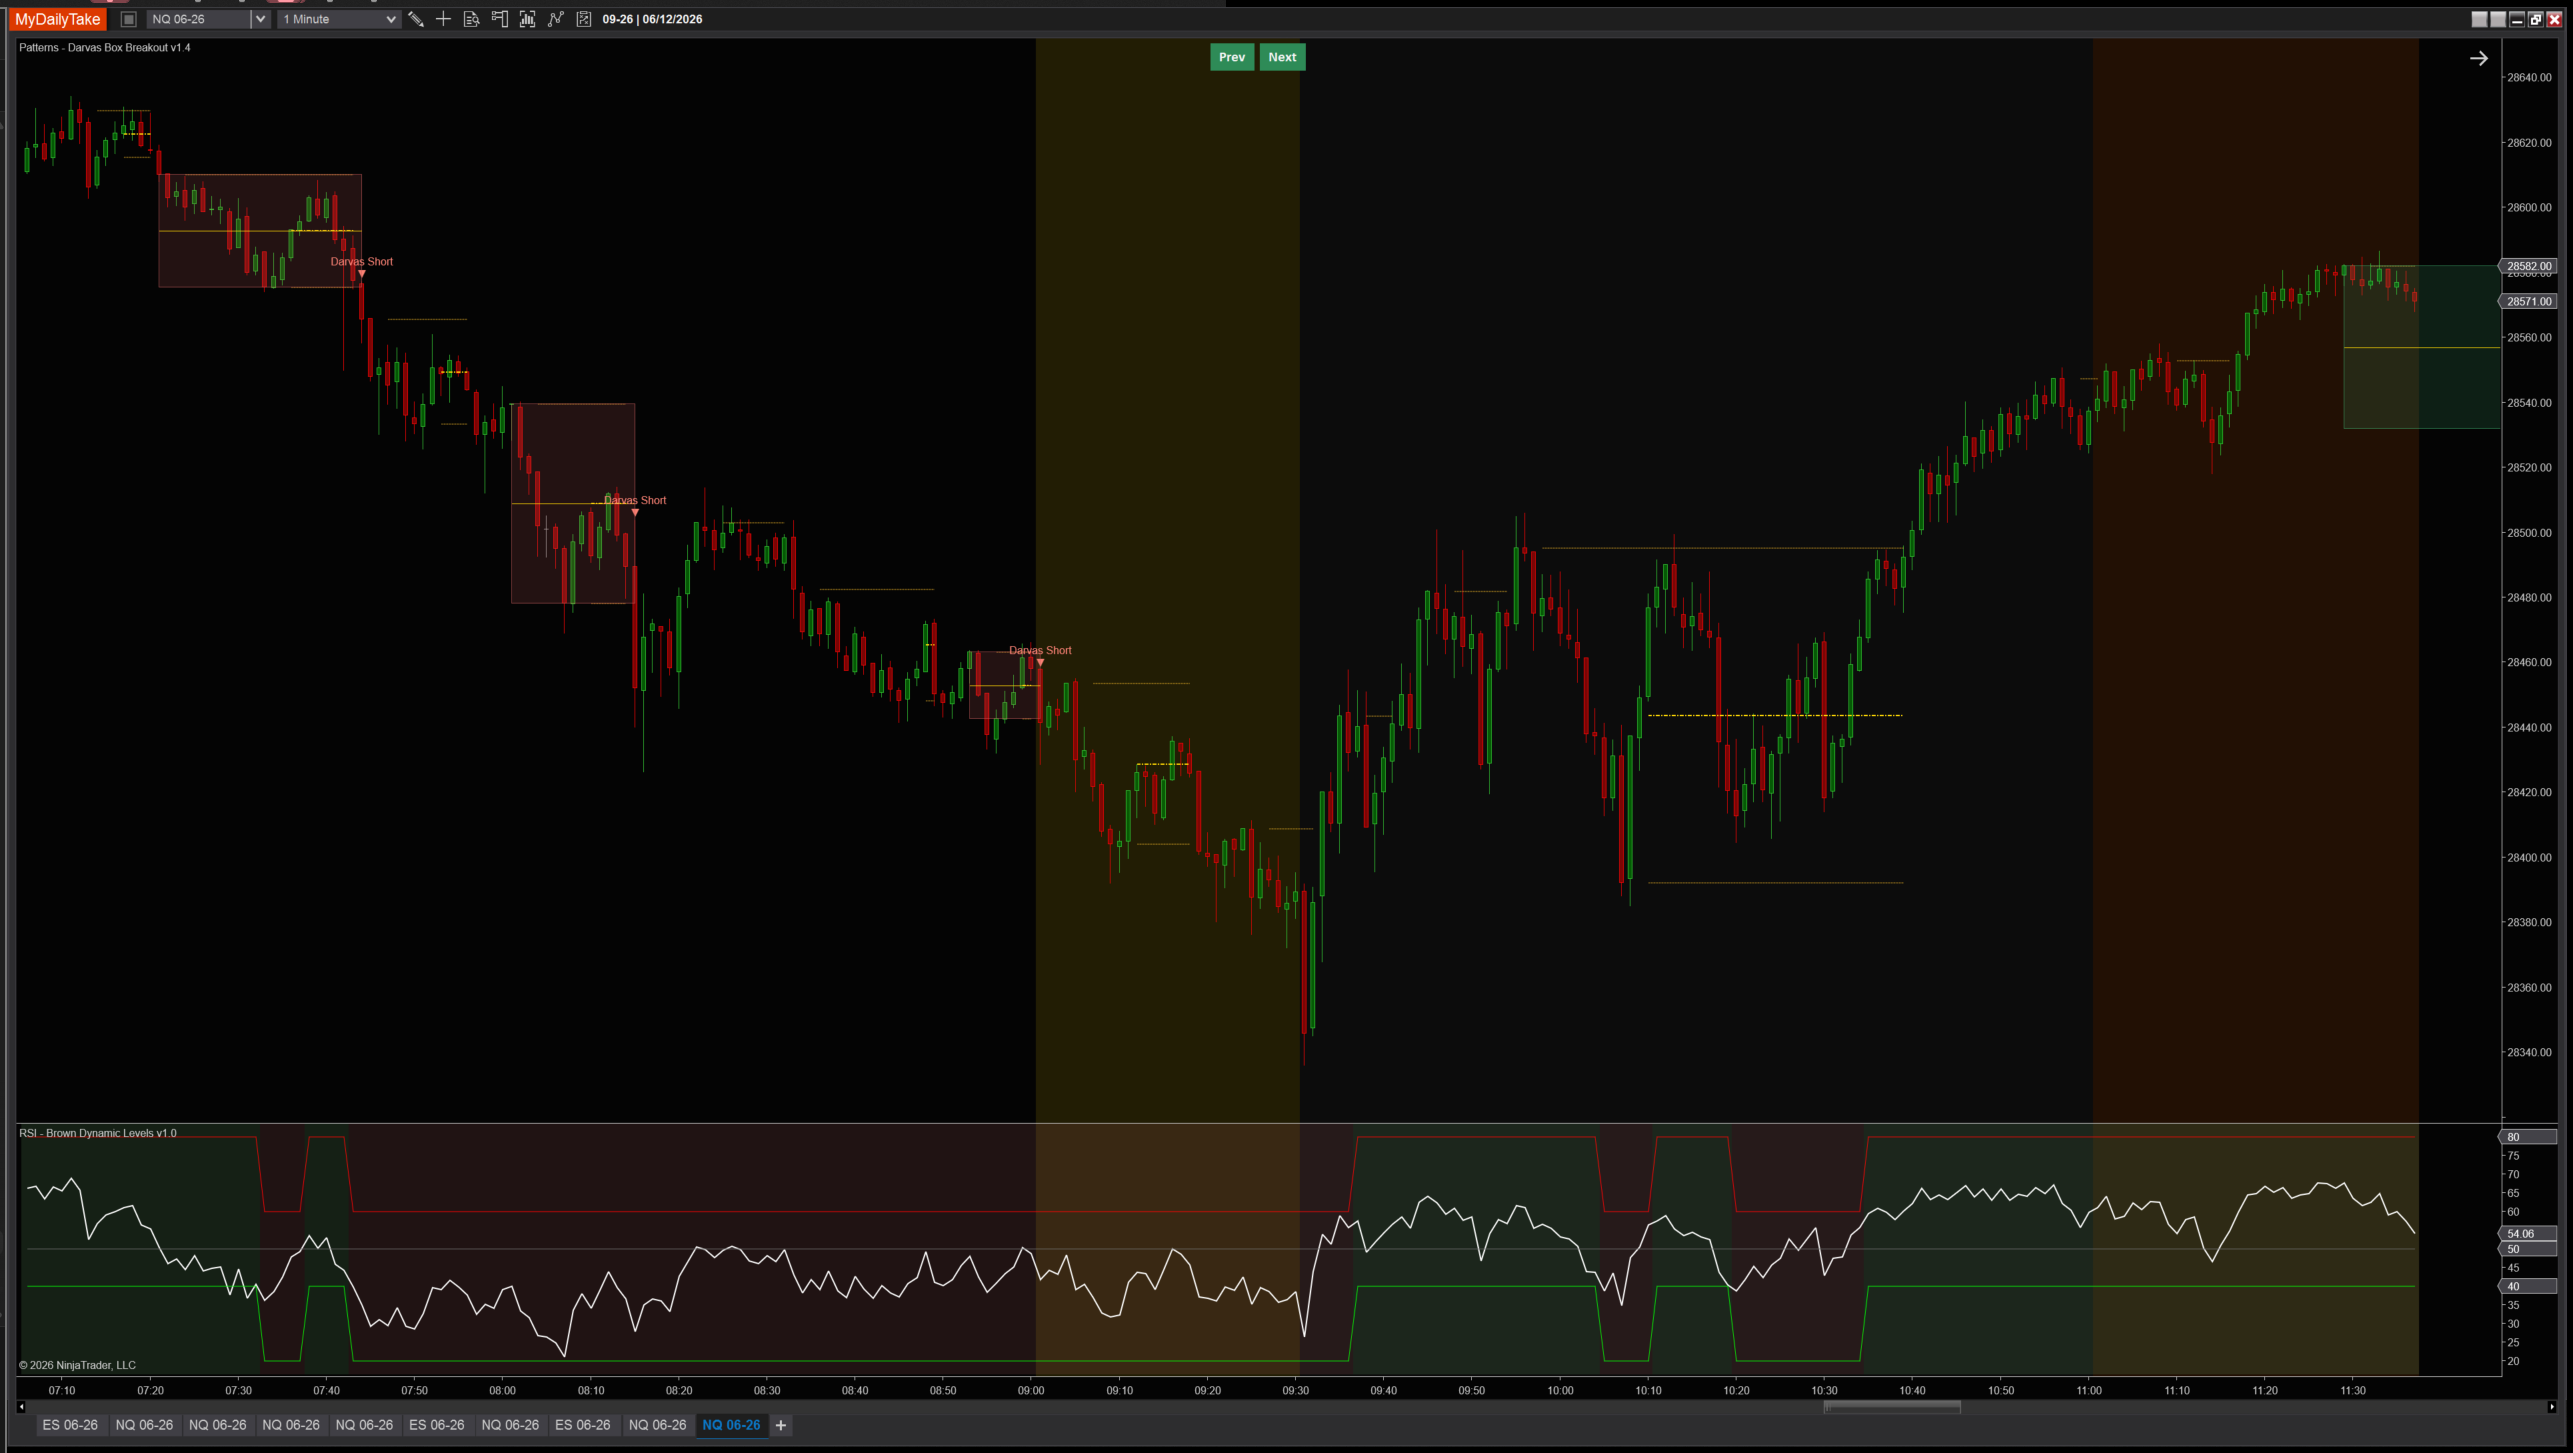
If you want to see where price tried to break out without volume — useful for backtest analysis and for understanding what the filter rejected — toggle Show Muted Breakout Boxes on. The volume-rejected boxes render with the same color coding as confirmed ones, but no signal triangle/label appears on them:
⚙️ Settings
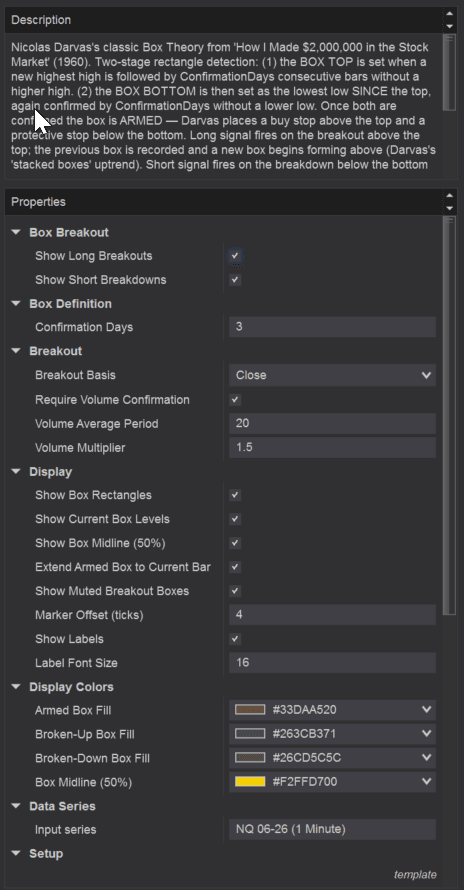
Settings are organized into five groups: Box Breakout, Box Definition, Breakout, Display, and Display Colors. The defaults match Darvas-canonical behavior wherever the book is specific (3-day confirmation, primary long signal); modern defaults are picked elsewhere (Close-basis breakout, volume gate off, both directions enabled).
Box Breakout
| Parameter | Description |
|---|---|
| Show Long Breakouts | Detect upward breakouts above the box top — Darvas's primary buy signal. |
| Show Short Breakdowns | Detect downward breakdowns below the box bottom. Darvas treated this as a stop-out, but it doubles as a short trigger on futures. |
Box Definition
| Parameter | Description |
|---|---|
| Confirmation Days | Number of consecutive bars without a higher high (for box top) or lower low (for box bottom) required to confirm each side. Darvas canonical = 3. Larger values produce wider, less-sensitive boxes. |
Breakout
| Parameter | Description |
|---|---|
| Breakout Basis | Close: breakout fires when Close is beyond the box level — stricter, no wick triggers. HighLow: fires intra-bar on High/Low — matches Darvas's buy-stop semantics. Default: Close. |
| Require Volume Confirmation | When ON, the breakout bar must trade with elevated volume vs. the recent average. Darvas put heavy emphasis on volume on breakout days. |
| Volume Average Period | Lookback for the prior-bar volume average (the breakout bar itself is excluded). Default 20. |
| Volume Multiplier | Breakout-bar volume must be at least this multiple of the recent average. Typical = 1.5. |
Display
| Parameter | Description |
|---|---|
| Show Box Rectangles | Draw rectangles for each completed box: armed-color while watching, broken-up-color after a long fires, broken-down-color after a short fires. |
| Show Current Box Levels | Plot the current (in-progress) box's top and bottom as horizontal dashed lines so the levels are tracked in real time. |
| Show Box Midline (50%) | Plot the midpoint of the box — a frequent intra-box support/resistance reference. Drawn as the current-box level when armed AND as a horizontal line inside each completed box rectangle. |
| Extend Armed Box to Current Bar | When ON, the currently-armed box's right edge tracks the latest bar — useful for actively watching for breakout. When OFF, the armed box stops at the bar where it was confirmed (Darvas's original drawing). |
| Show Muted Breakout Boxes | When ON, also render boxes that broke a level but did NOT fire a signal (volume filter rejected, or ShowLong/ShowShort off). When OFF (default), only signal-confirmed broken boxes and the currently-armed box render. |
| Marker Offset (ticks) | Vertical offset of the breakout markers from the bar's high/low, in ticks. Default 4. |
| Show Labels | Render signal labels (Darvas Long / Darvas Short) next to each breakout marker. |
| Label Font Size | Font size for the signal labels. |
Display Colors
| Parameter | Description |
|---|---|
| Armed Box Fill | Fill brush for boxes still watching for breakout. The picked color's alpha channel IS the fill opacity. Default: Goldenrod 0.20. |
| Broken-Up Box Fill | Fill brush for boxes that broke upward (long signal fired). Alpha = fill opacity. Default: MediumSeaGreen 0.15. |
| Broken-Down Box Fill | Fill brush for boxes that broke downward (short signal fired, or the box was invalidated by a lower low when shorts are muted). Alpha = fill opacity. Default: IndianRed 0.15. |
| Box Midline (50%) | Brush for the 50% midline drawn across each box. Alpha = line opacity. Default: Gold 0.95. |
📝 When It Works, When It Doesn’t
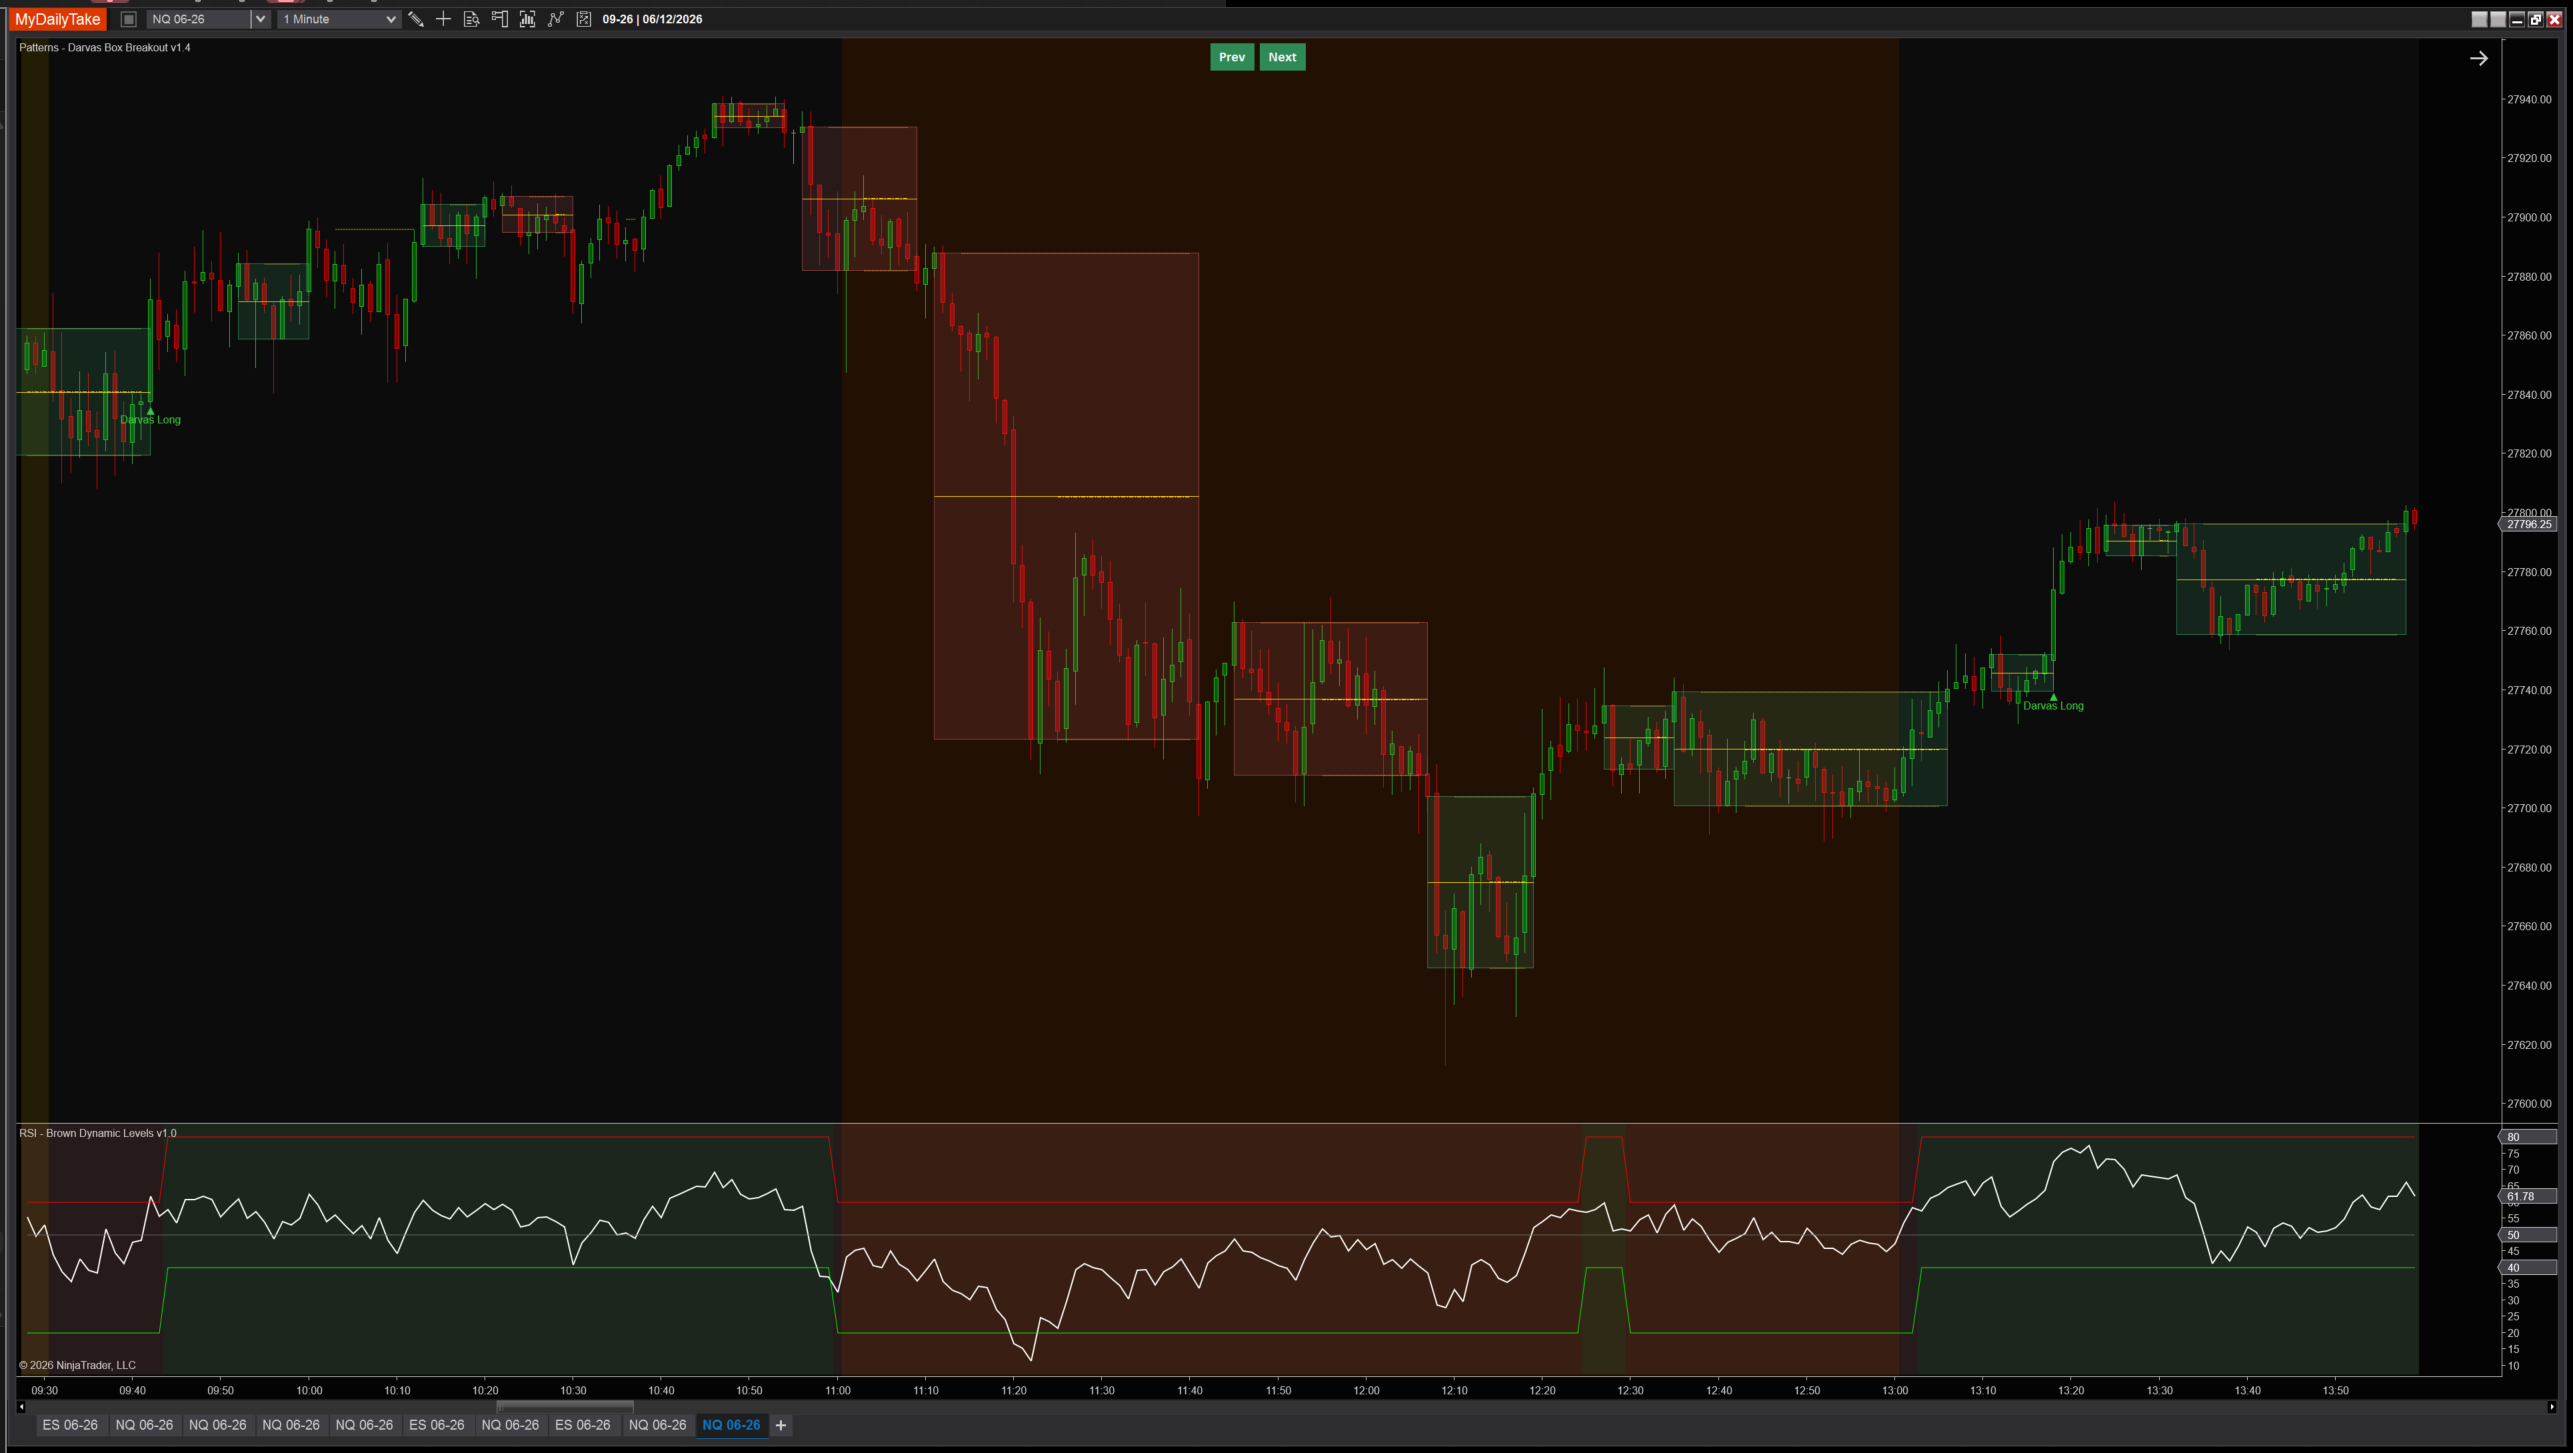
Darvas’s system was built for trending markets. He picked stocks that were already moving, and he expected the next box to print above the current one. In strong trends, the indicator does exactly what you’d hope: a clean stack of broken boxes climbing the chart, with the current armed box telegraphing where the next breakout will fire.
In choppy, range-bound markets the picture is messier. Boxes form, break, and re-form repeatedly without follow-through, and you’ll get a string of failed breakouts in both directions. That’s where the volume gate and a regime filter (RSI, ADX, MA-slope, your-favorite-trend-thing) earn their keep — they’re the difference between trading every breakout and trading the breakouts that have a chance.
📦 Download
To install:
- Download the .zip file using the button above.
- In NinjaTrader 8, go to Tools → Import → NinjaScript Add-On.
- Select the downloaded .zip file.
- The indicator appears under Indicators → indMyDailyTake → Patterns – Darvas Box Breakout on your chart.


This indicator implements Box Theory as described in Nicolas Darvas’s 1960 book How I Made $2,000,000 in the Stock Market. The implementation is by MyDailyTake.com and adds modern conveniences (configurable confirmation count, optional short signals, volume filter, customizable rendering) on top of the canonical algorithm. Use at your own risk; trading the same setups Darvas traded does not guarantee Darvas-like outcomes.