Learn NinjaScript: Adding Tooltips and Hover Text
Tooltips live in two places in a NinjaScript indicator. The first is the settings dialog — the small hover text that explains what a property does. The second is the chart itself — labels and annotations attached to drawn objects that show context when a trader hovers over them. Both are cheap to add, both make an indicator feel more complete, and both have specific idioms that work well and specific ones that don’t.
This post covers both: writing good Description text for the property grid, and attaching tooltip-style hover text to chart draw objects.
⚙️ Two Kinds of Tooltips
The settings-dialog tooltip comes from the Description parameter on the [Display] attribute. Hover over a property in the indicator’s Properties dialog, wait a beat, and the text shows up. It’s targeted at users who are tuning the indicator — they want to know what a knob does without leaving the dialog to read documentation.
The chart-side tooltip is different. It’s for objects a user sees on the chart — a zone, a line, a signal marker — where the visual itself is ambiguous without extra context. Chart tooltips are usually attached to Draw.* objects and appear when the user hovers directly over the shape.
These two live in separate systems. The settings tooltip is attribute metadata on a C# property. The chart tooltip is a runtime state of a draw object. One is static, one is dynamic. Both matter.
🏷️ Property Grid Tooltips via [Display(Description)]
The mechanics are exactly what Post 5 covered — Description on the [Display] attribute. The part that matters for this post is writing text that actually helps.
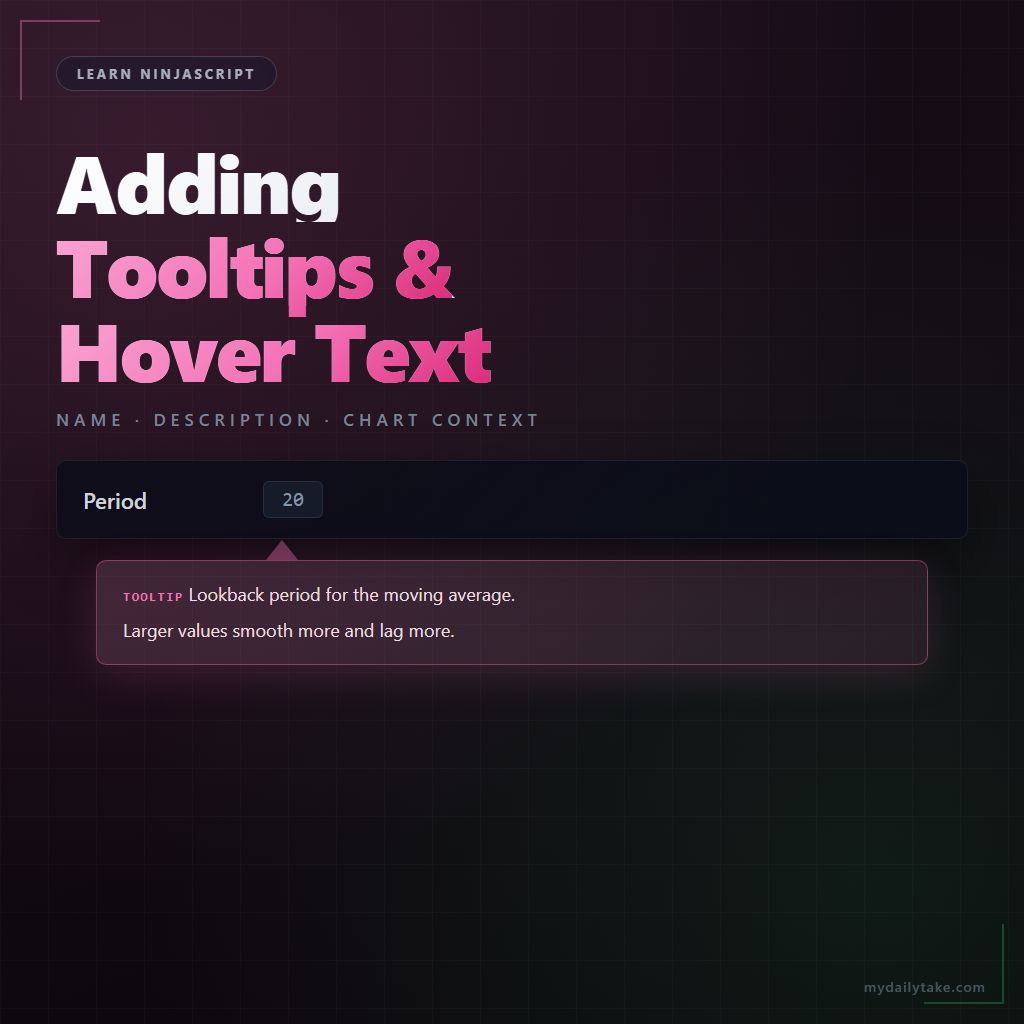
What good Description text does: explains what the parameter affects, mentions the unit or expected range when the answer isn’t obvious from the name, and stays short. The grid’s tooltip width is limited; long sentences wrap awkwardly and often get cut off.
What bad Description text does: repeats the property name (“The period setting sets the period”), describes mechanics the user doesn’t care about (“An integer field passed to the SMA constructor”), or adds no information the Name didn’t already convey.
Good examples:
Description = "Lookback period for the moving average. Larger values smooth more and lag more."Description = "ATR standard deviation threshold for filtering outlier bars. Set to 0 to disable."Description = "Number of closed bars required before a reversal is committed."
Each one says something the property name alone doesn’t. That’s the test — would a user who just read the Name learn anything new from the Description?
📏 Chart Tooltips on Draw Objects
Draw objects can carry tooltip-style text that appears when the user hovers over the shape. The mechanism is Draw.Text with the isGlobal flag plus an areaBrush background so the text stays readable against the chart. You can also create text that hovers alongside a Draw.Line or Draw.Rectangle by positioning it carefully at the shape’s center.
The simpler alternative — and the one most chart-attached tooltips end up using — is a short text label drawn at the shape’s position with a unique tag. When the user hovers, they read the label directly. No special “tooltip” API; the label itself is the tooltip.
This matters most on indicators that draw zones, levels, or signal marks that a trader might want to understand weeks later. “Why did my FVG indicator mark this zone?” is easier to answer if the zone carries a small timestamp or comment label.
🎯 When Tooltips Help vs When They Hurt
A tooltip helps when it adds information that isn’t visible from context alone. It hurts when it repeats information already on the label, adds visual clutter, or delays the user from seeing the action they were about to take.
Three questions that settle it:
- Does the tooltip say something the label doesn’t? If not, cut it. A label that reads “Period” and a tooltip that reads “The period value” is noise.
- Is the information critical or supplemental? Critical information belongs in the label itself. Tooltips are for the curious, not the essential.
- Would a better Name solve it? If your tooltip is compensating for an unclear Name, rename instead. The Name is what every user reads; the tooltip is what the occasional user hovers to see.
🛠️ The Anchor Example — MySma With Polished Descriptions
Continuing MySma from previous weeks. The properties got [Display] attributes in Post 5; now we polish the Description text on each so they carry their weight:
[NinjaScriptProperty]
[Range(2, int.MaxValue)]
[Display(Name = "Period", GroupName = "Indicator Setup", Order = 1,
         Description = "Lookback period for the moving average. Larger values smooth more and lag more.")]
public int Period { get; set; }

[NinjaScriptProperty]
[Range(0.01, double.MaxValue)]
[Display(Name = "Multiplier", GroupName = "Indicator Setup", Order = 2,
         Description = "Multiplies the plotted SMA value. Useful for scaling the line to match another series on the chart.")]
public double Multiplier { get; set; }

[Display(Name = "Show Dots", GroupName = "Display", Order = 1,
         Description = "Draws a colored dot at each bar on the SMA line. Useful for reading values at a glance.")]
public bool ShowDots { get; set; }
Each Description adds a sentence the property name alone wouldn’t give. Not a paragraph — a sentence. The user hovers, reads, and is back to tuning.
For a chart-side tooltip on a draw object, the pattern is similarly light. If MySma drew a dot at each bar, a short label attached to the latest dot could show the current value:
if (ShowDots)
{
    Draw.Dot(this, "dot_" + CurrentBar, false, 0,
             Values[0][0], Brushes.LimeGreen);

    // Attach a short label only to the most recent bar.
    if (CurrentBar == Bars.Count - 1)
    {
        Draw.Text(this, "dotlabel", true,
                  "SMA: " + Values[0][0].ToString("F2"),
                  0, Values[0][0] + TickSize * 4, 0,
                  Brushes.LimeGreen, new SimpleFont("Arial", 10),
                  TextAlignment.Center, null, null, 1);
    }
}
Small — and the last bar alone, not every bar. Label every bar and the chart becomes unreadable.
📝 Pitfalls Checklist
- Tooltip text that just restates the Name.
Name = "Period"withDescription = "The period parameter"teaches nothing. Cut the description. - Multi-line Descriptions. The grid tooltip wraps awkwardly past about one sentence. Keep it tight.
- Description on expandable types.
SimpleFont,Stroke, and anyExpandableObjectConverter-based type ignore theDescriptionparameter — the help guide’s own warning from Post 5. Don’t write text that never shows. - Chart labels on every bar. What reads clean on the last five bars becomes noise on a thousand. Label selectively — latest bar, signal bars, important levels only.
- Tooltip compensating for a bad Name. If you need a tooltip to explain what the property does, rename the property so the name itself conveys it.
- Redrawing the same label every bar without cleanup. Use a single stable tag (e.g.,
"latest_label") rather than"label_" + CurrentBarwhen only one label should exist at a time. See Post 2’s draw-cleanup patterns.
🎉 Prop Trading Discounts
💥89% off at Bulenox.com with the code MDT89