
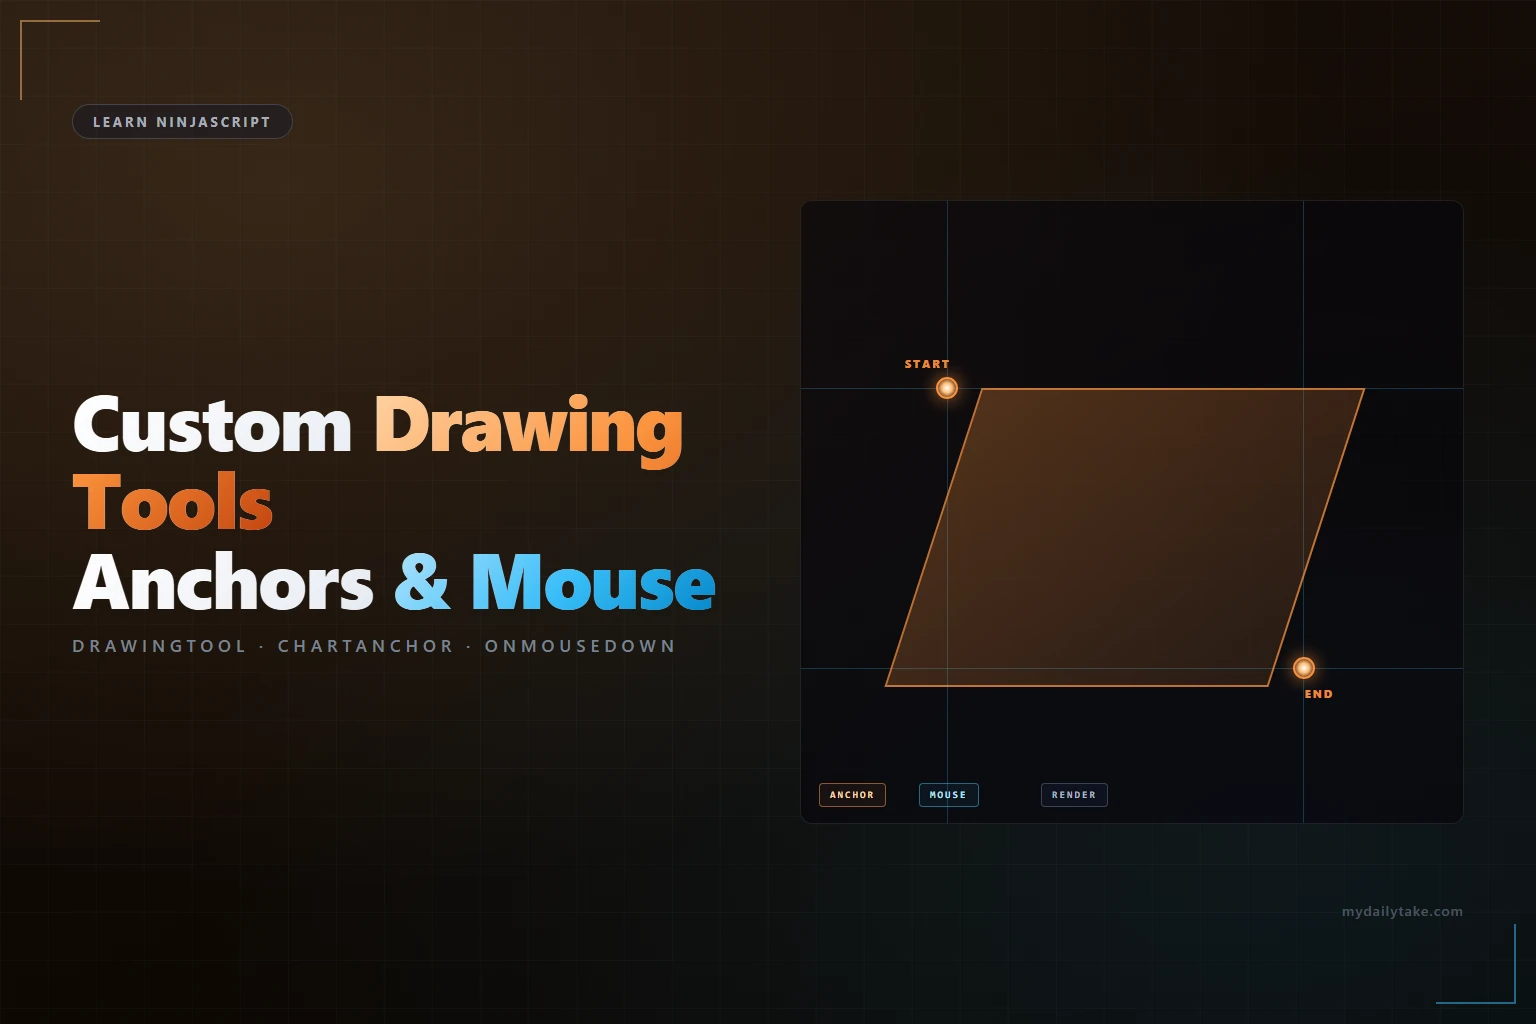
Learn NinjaScript: Creating Custom Drawing Tools (Advanced)
Every Draw.* call from the prior posts produces a static object — it appears where your code puts it and doesn’t move unless the code tells it to. Custom drawing tools are the other category: the draggable, anchored, user-placed shapes behind Lines, Rectangles, Fibonacci, Andrews Pitchfork in the chart toolbar. Users click to place anchors, drag to reposition, and the tool persists across chart saves.
Building one is the most NinjaTrader-UI-native thing you can do and the most code to write. This post is an orientation, not a full tutorial — what class to extend, the anchor system, where mouse handling fits, and the shape of a minimum viable custom tool. By the end you’ll understand the scaffolding well enough to build from.
⚙️ DrawingTool vs Draw.*
The question to ask first: does the user need to manipulate this shape? If the answer is no — a signal arrow that appears at a bar’s close and stays there — Draw.* is the right tool. If the answer is yes — a box the user drags across several bars to define a zone they care about — you want a DrawingTool subclass.
- Appears in the chart’s Drawing Tools menu. User picks it from the toolbar or menu like any built-in tool.
- Owns anchor objects. One or more
ChartAnchors that the tool itself places, moves, and persists. - Reacts to mouse events. Mouse down places an anchor, mouse drag moves it, mouse up commits the state.
- Persists with the chart. A tool the user placed at 11:04 survives a chart reload;
Draw.*output has to be regenerated fromOnBarUpdateevery time. - Can show properties in the tool’s right-click menu. Color, style, line weight — everything the user expects from a built-in tool.
📍 The Anchor System
A ChartAnchor is a point on the chart stored as time + price, not pixels. This is the single most important thing about drawing tools: anchors persist across zoom levels, window resizes, and chart reloads because they’re stored in the chart’s own coordinate system — a timestamp and a price — rather than a pixel position that would be meaningless at a different zoom.
Anchors are declared as properties on the tool class, and NT handles the serialization automatically:
public class AngledZone : DrawingTool
{
    [Display(Order = 1)]
    public ChartAnchor StartAnchor { get; set; }

    [Display(Order = 2)]
    public ChartAnchor EndAnchor   { get; set; }

    public override IEnumerable<ChartAnchor> Anchors
    {
        get { yield return StartAnchor; yield return EndAnchor; }
    }

    protected override void OnStateChange()
    {
        if (State == State.SetDefaults)
        {
            Name         = "Angled Zone";
            DrawingState = DrawingState.Normal;

            StartAnchor = new ChartAnchor { IsEditing = true, DrawingTool = this };
            EndAnchor   = new ChartAnchor { IsEditing = true, DrawingTool = this };
        }
    }
}
Two anchors for a two-point tool, three for a Fibonacci-retracement-style tool, four for an Andrews Pitchfork. The Anchors enumeration is what the NT core uses to hit-test and move anchors on the user’s behalf — if it’s not in the enumeration, NT can’t drag it.
To read an anchor’s pixel position in OnRender, call anchor.GetPoint(chartControl, chartPanel, chartScale). This is the anchor-system analog of GetXByBarIndex plus GetYByValue — it does the conversion for you, so the tool follows the user’s zoom automatically.
🖱️ Mouse Handlers
A drawing tool’s life cycle runs through three mouse states: placing the first anchor, placing subsequent anchors (or dragging to size), and committing to Normal. The DrawingState enum tracks where the tool is, and the three mouse overrides advance it:
public override void OnMouseDown(ChartControl chartControl, ChartPanel chartPanel,
                                  ChartScale chartScale, ChartAnchor dataPoint)
{
    if (DrawingState == DrawingState.Building)
    {
        if (StartAnchor.IsEditing)
        {
            dataPoint.CopyDataValues(StartAnchor);
            StartAnchor.IsEditing = false;
        }
        else if (EndAnchor.IsEditing)
        {
            dataPoint.CopyDataValues(EndAnchor);
            EndAnchor.IsEditing = false;
            DrawingState = DrawingState.Normal;
            IsSelected   = false;
        }
    }
}

public override void OnMouseMove(ChartControl chartControl, ChartPanel chartPanel,
                                  ChartScale chartScale, ChartAnchor dataPoint)
{
    if (DrawingState == DrawingState.Building && EndAnchor.IsEditing)
        dataPoint.CopyDataValues(EndAnchor);   // live preview while placing
    else if (DrawingState == DrawingState.Editing && editingAnchor != null)
        dataPoint.CopyDataValues(editingAnchor);
}

public override void OnMouseUp(ChartControl chartControl, ChartPanel chartPanel,
                                ChartScale chartScale, ChartAnchor dataPoint)
{
    if (DrawingState == DrawingState.Editing)
        DrawingState = DrawingState.Normal;
    editingAnchor = null;
}
The dataPoint parameter is already a valid ChartAnchor — NT computed the time and price from the mouse coordinates before calling. CopyDataValues copies time/price from it onto your anchor without allocating.
Two state transitions matter: Building→Normal when the user has finished placing all anchors, and Normal→Editing when the user starts dragging an existing anchor. The tool is active on the chart only during Normal; Building is the “still being placed” intermediate and Editing is the “being dragged” state.
🎨 Rendering
A drawing tool gets its own OnRender override. The signature and DX primitives are the same as an indicator’s OnRender — RenderTarget.FillGeometry, DrawTextLayout, all the same — but the inputs come from anchors instead of a Series. The per-frame work is: read anchor positions via GetPoint, compute the shape, draw it.
The gating you use in an indicator (RenderTarget == null, IsVisible, IsInHitTest) still applies. The big difference: a drawing tool only renders when it’s actually on the chart — there’s no “historical playback” equivalent, no bar loop to iterate. The render runs once per frame per tool instance.
🛠️ The Anchor Example — Angled Zone Tool
A minimum viable “angled zone” drawing tool: the user clicks two points, the tool draws a filled parallelogram spanning the bars between them at the two anchored prices. This is the scaffolding — color/style/line-weight properties, anchor hit testing, and cursor feedback are left as the next step:
public override void OnRender(ChartControl chartControl, ChartScale chartScale)
{
    if (DrawingState == DrawingState.Building) return;   // not finished placing
    if (StartAnchor.IsEditing || EndAnchor.IsEditing) return;

    ChartPanel panel = chartControl.ChartPanels[chartScale.PanelIndex];

    var p1 = StartAnchor.GetPoint(chartControl, panel, chartScale);
    var p2 = EndAnchor.GetPoint(chartControl, panel, chartScale);

    var a = new SharpDX.Vector2((float)p1.X, (float)p1.Y);
    var b = new SharpDX.Vector2((float)p2.X, (float)p1.Y);
    var c = new SharpDX.Vector2((float)p2.X, (float)p2.Y);
    var d = new SharpDX.Vector2((float)p1.X, (float)p2.Y);

    SharpDX.Direct2D1.PathGeometry geom = null;
    SharpDX.Direct2D1.GeometrySink sink = null;
    try
    {
        geom = new SharpDX.Direct2D1.PathGeometry(Core.Globals.D2DFactory);
        sink = geom.Open();
        sink.BeginFigure(a, SharpDX.Direct2D1.FigureBegin.Filled);
        sink.AddLine(b); sink.AddLine(c); sink.AddLine(d);
        sink.EndFigure(SharpDX.Direct2D1.FigureEnd.Closed);
        sink.Close();
        RenderTarget.FillGeometry(geom, fillBrush);
    }
    finally
    {
        if (sink != null) sink.Dispose();
        if (geom != null) geom.Dispose();
    }
}
The GetPoint call converts each anchor from time/price to a pixel position at the current zoom, so the parallelogram follows the chart when the user scrolls. The try/finally disposes the geometry resources even if FillGeometry throws — a native-resource leak here accumulates every frame the tool is visible, which on a heavily-used chart is hundreds of times per second.
📝 Pitfalls Checklist
- Treating it like an indicator’s OnRender. The tool’s render lifecycle is driven by anchor state and
DrawingState, not by bar updates. There’s noOnBarUpdate; all state changes happen through mouse events. - Storing pixel coordinates in anchors. Anchors must be time + price. A pixel position is meaningless when the user zooms or resizes — the tool will float away or disappear.
ChartAnchorstores time and price; don’t add custom pixel-coordinate fields. - Anchors missing from the
Anchorsenumeration. Declared as properties but not yielded by theAnchorsgetter. NT’s hit-testing and dragging code iteratesAnchors; anything not there can’t be dragged and won’t serialize properly. Yield every anchor. - Mouse handlers firing during chart scroll. Pan and zoom generate mouse events. Guard handlers on
DrawingState == BuildingorDrawingState == Editingso a user’s panning doesn’t reposition an anchor. - Tool appears in the menu but doesn’t render. The class compiles and shows up under Drawing Tools, but clicking on the chart produces nothing. Usually:
DrawingStatenever transitions out ofBuilding, orOnRenderis guarded on a condition that’s never true. Work backward from “isOnRenderbeing called” to find the break. - Not disposing SharpDX geometry and sink. Every frame. Every parallelogram. Memory climbs and frames drop. The
try/finallydispose pattern is the fix; the garbage collector doesn’t help with native resources.


