Learn NinjaScript: Creating Visual Symbol Markers (Arrows, Icons)
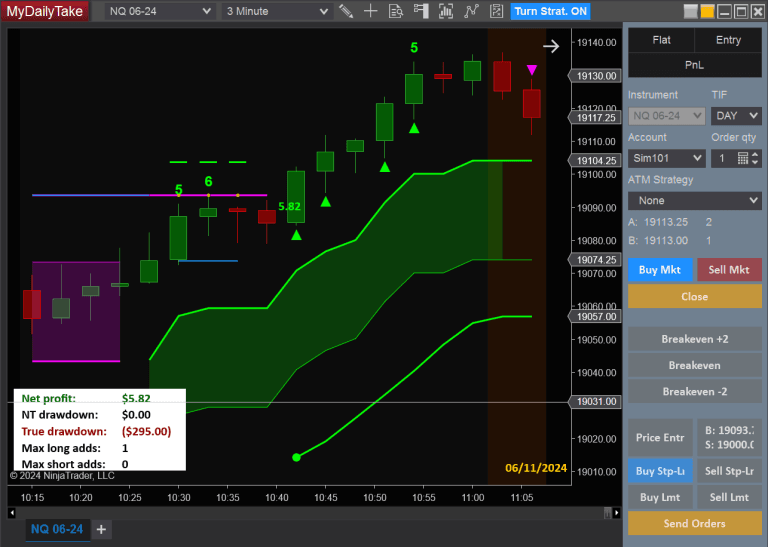
Signals need to be visible on the chart. Arrows for entries, triangles for reversals, dots for bar-by-bar markers, diamonds for key levels. NinjaScript’s Draw.* family ships a handful of stock marker types that cover most needs — the mechanics are simple, the UX details are what separate a polished indicator from a sloppy one.
This post covers the marker types, the positioning conventions that scale across instruments, tag management for per-bar markers, and the cleanup that keeps stale markers from accumulating.
⚙️ The Marker Types
NinjaScript’s built-in marker draws:
Draw.ArrowUpandDraw.ArrowDown— filled arrows pointing up or down. Most common for entry signals.Draw.TriangleUpandDraw.TriangleDown— solid triangles. Smaller visual footprint than arrows.Draw.Dot— circular marker. Useful for bar-by-bar output where each bar gets its own mark.Draw.Diamond— diamond shape. Often used for level confirmation or trend-change points.Draw.Square— square marker. Less common but available.
Pick one type per signal category. Don’t mix — an indicator that draws arrows for entries, diamonds for exits, and dots for confirmation becomes unreadable fast. Consistency is more important than variety.
📏 Positioning Conventions
The y-coordinate is where the marker anchors. Above a bar on a buy signal, below a bar on a sell signal. Offset from the bar’s extreme by a multiple of TickSize — not a hardcoded pixel value — so the spacing scales correctly across instruments:
// Buy arrow below the bar's low, offset by 2 ticks.
Draw.ArrowUp(this, "buy_" + CurrentBar, false, 0,
             Low[0] - TickSize * 2, Brushes.LimeGreen);

// Sell arrow above the bar's high, offset by 2 ticks.
Draw.ArrowDown(this, "sell_" + CurrentBar, false, 0,
               High[0] + TickSize * 2, Brushes.Red);
TickSize * 2 on ES (tick = 0.25) is half a point. On NQ (tick = 0.25), same. On CL (tick = 0.01), it’s two cents. On a stock with tick = 0.01 at $50, it’s two cents. The offset scales with the instrument — an offset of 0.5 hardcoded would look giant on a stock and invisible on NQ. TickSize-based offsets just work.
For instruments with very different tick-to-price ratios (forex vs futures, for example), consider scaling by ATR instead: High[0] + ATR(14)[0] * 0.1. ATR adapts to the instrument’s actual volatility profile, not just its tick size.
🏷️ Tag Patterns
Each marker needs a tag. For per-bar markers (one per qualifying bar), include CurrentBar in the tag so each marker is unique:
string tag = "sig_" + CurrentBar; // new tag every qualifying bar
For a single persistent marker (e.g., “highest value seen today” that moves as new highs are set), use a single fixed tag. Calling Draw.Dot(this, "highest", ...) on each new high updates the dot to the new position because the tag is stable.
🎨 Per-Bar Color Logic
Signal strength can be communicated through color. An entry with weak confirmation gets a dimmer brush; a strongly confirmed entry gets bright green. The pattern is just picking the brush at draw time based on whatever your strength metric is:
Brush arrow;
if      (confirmationStrength >= 3) arrow = Brushes.LimeGreen;
else if (confirmationStrength >= 2) arrow = Brushes.Green;
else                                arrow = Brushes.DarkGreen;

Draw.ArrowUp(this, "sig_" + CurrentBar, false, 0,
             Low[0] - TickSize * 2, arrow);
Use it sparingly. Three shades of green is usually enough; six shades is visual noise.
🔁 Cleanup on Condition Change
When running on OnPriceChange or OnEachTick, a signal that fires mid-bar and then invalidates before bar close needs explicit cleanup. Call RemoveDrawObject(tag) at the top of OnBarUpdate, then re-evaluate:
protected override void OnBarUpdate()
{
    if (CurrentBar < Period) return;

    string tag = "sig_" + CurrentBar;
    RemoveDrawObject(tag);   // clear any arrow from an earlier tick

    if (ConditionIsCurrentlyTrue())
        Draw.ArrowUp(this, tag, false, 0,
                     Low[0] - TickSize * 2, Brushes.LimeGreen);
}
This is the same pattern from Post 3. The arrow appears on the live bar when the condition holds and disappears when it doesn’t, so the signal matches what will eventually show on a historical replay of that bar.
🛠️ The Anchor Example — MySma With Cross Arrows
Extending MySma with buy/sell arrows on SMA crosses, sized relative to TickSize, color-coded by direction, and cleaned up if the cross invalidates mid-bar:
protected override void OnBarUpdate()
{
    if (CurrentBar < Period) return;

    string tagUp   = "up_"   + CurrentBar;
    string tagDown = "down_" + CurrentBar;
    RemoveDrawObject(tagUp);
    RemoveDrawObject(tagDown);

    if (CrossAbove(Close, SMA(Period), 1))
        Draw.ArrowUp(this, tagUp, false, 0,
                     Low[0] - TickSize * 2, Brushes.LimeGreen);

    if (CrossBelow(Close, SMA(Period), 1))
        Draw.ArrowDown(this, tagDown, false, 0,
                       High[0] + TickSize * 2, Brushes.Red);
}
Arrows placed cleanly, offset scales across instruments, live bars stay consistent with historical replay.
📝 Pitfalls Checklist
- Hardcoded pixel or price offsets.
Low[0] - 0.5looks right on one chart and absurd on another. Always useTickSizemultiples orATR. - Same tag for multiple per-bar markers. They overwrite each other; only the last drawn appears. Bar-stamped tags solve it.
- Forgetting the cleanup on live modes. Markers drift or ghost when conditions flip within a bar.
- Arrow at the wrong Y. Above a bar means above the bar’s High; below means below the Low. Swapping them places arrows inside the bar body, which is almost always wrong.
- isAutoScale flag confusion. Setting it to
trueincludes the marker’s Y in the auto-scale range, which can squash price if the marker ends up above the visible range. Usefalsefor offsets and let the bars define the range. - Different marker types for the same signal category. Arrows for morning entries and triangles for afternoon entries means the reader has to decode the visual language. Pick one and stick.


![Cosine Kernel Regressions [QuantraSystems] Conversion](https://mydailytake.com/wp-content/uploads/2024/06/CosineKernelRegressions_5-Minute_NQ-768x458.png)