
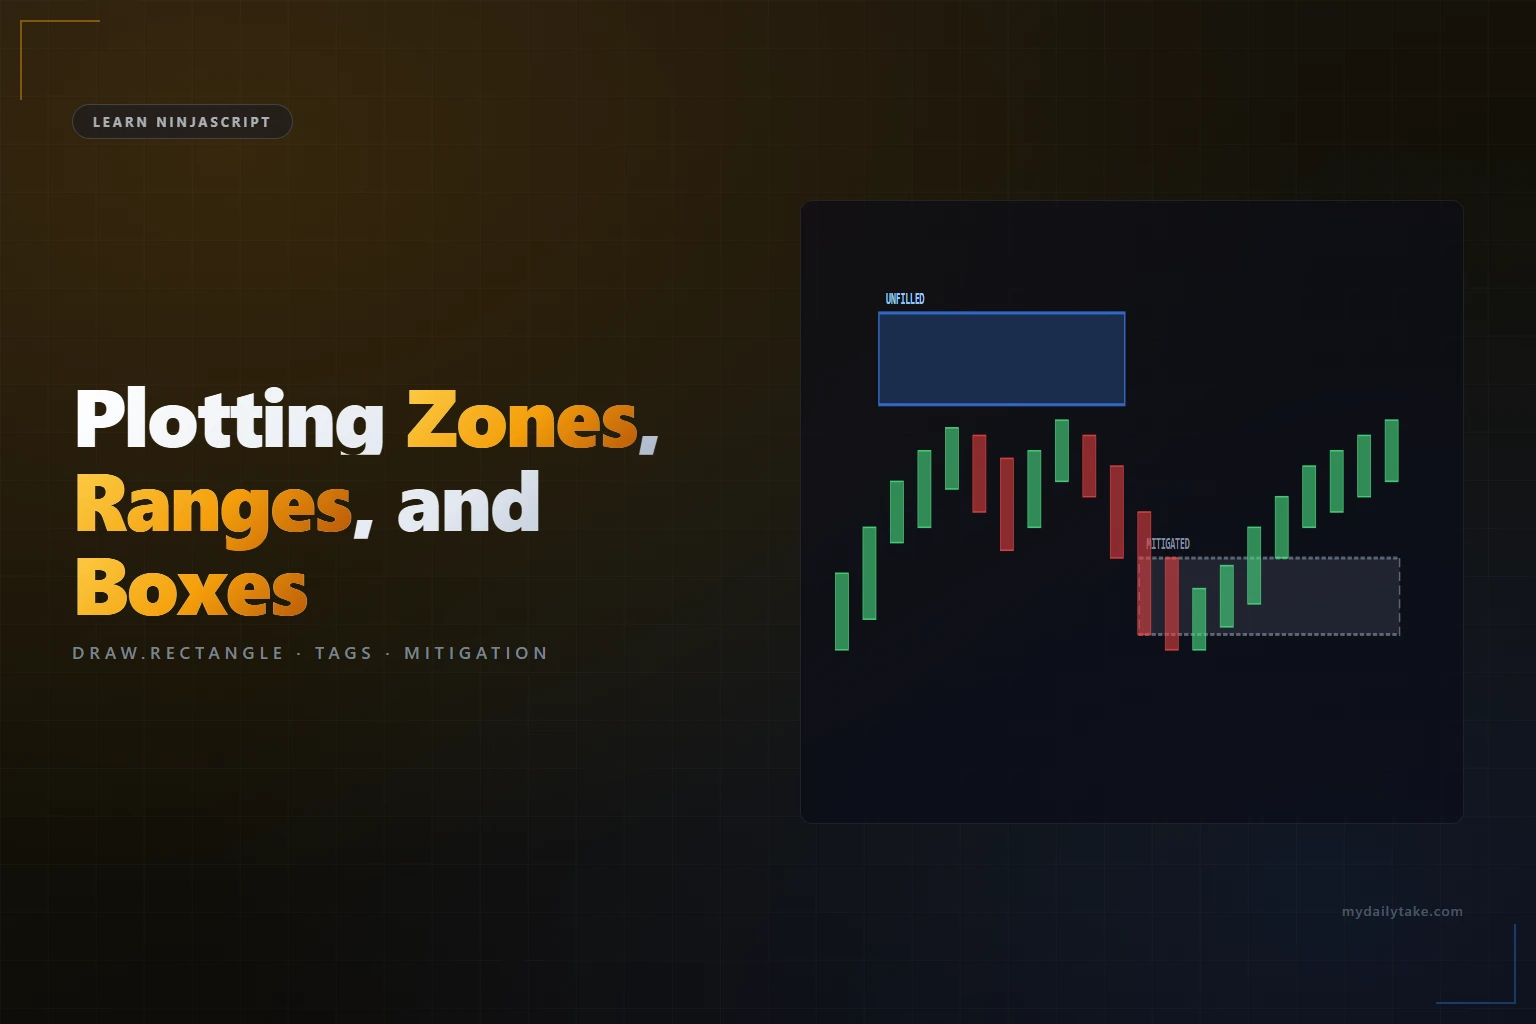
Learn NinjaScript: Plotting Zones, Ranges, and Boxes
Zones and ranges carry more information than lines. A Fair Value Gap is a box that tells you where price left unfilled orders. An Opening Range is a box bounded by the first session hour’s high and low. A Supply/Demand zone is a rectangle with a story — price rejected from this area, and traders watch it as a reference.
Draw.Rectangle is the building block. The real skill is tag management — drawing a rectangle once, growing or recoloring it as price develops, removing it cleanly when the zone invalidates.
⚙️ Draw.Rectangle Signature
The core call draws a rectangle anchored at two points:
Draw.Rectangle(this,
    "tag",              // unique identifier
    false,              // isAutoScale
    startBarsAgo,       // left edge (how many bars back)
    startY,             // top or bottom — order doesn't matter
    endBarsAgo,         // right edge
    endY,
    Brushes.Lime,       // border color
    Brushes.Lime,       // fill color
    30);                // fill alpha (0-100)
The tag is the critical parameter. It’s the identity of this rectangle across bars. Call Draw.Rectangle again with the same tag and you update the existing rectangle rather than creating a new one. Call with a different tag and you create a new rectangle that stays around until you remove it.
🏷️ Tag Management
Tags should be unique per logical zone and stable across bars. The common pattern is to include the bar the zone was detected on:
string tag = "fvg_" + CurrentBar; // unique to the bar where the FVG was detected
Every zone gets its own bar-stamped tag. When you call Draw.Rectangle(this, tag, ...) on a later bar with the same tag, you extend or modify that zone. Different tag means new zone.
Avoid time-based tags like "fvg_" + Time[0].Ticks. They technically work but make it harder to correlate tags back to specific bars when debugging.
📐 Growing Zones
A zone that should extend its right edge as new bars form — supply/demand zones, unfilled order blocks, persistent levels — gets redrawn each bar with the same tag but a new right-edge barsAgo:
// On every bar, extend the zone's right edge to the current bar.
if (zoneIsActive)
{
    Draw.Rectangle(this, zoneTag, false,
        zoneStartBarsAgo, zoneTop,
        0,                zoneBottom,      // right edge always at current bar
        Brushes.DodgerBlue, Brushes.DodgerBlue, 25);
}
zoneStartBarsAgo increases every bar as the zone ages — if the zone was created 5 bars ago and we’re now 10 bars past its creation, zoneStartBarsAgo = 10. The right edge stays at 0 (current bar). Same tag, so the draw call updates rather than duplicates.
🎨 Recoloring on State Change
When a zone transitions state — unfilled FVG becomes partially filled, an unmitigated order block becomes mitigated — redraw with a different brush:
// Detect mitigation: price entered the zone.
bool mitigated = Low[0] <= zoneTop && High[0] >= zoneBottom;

Brush fillBrush = mitigated ? Brushes.Gray : Brushes.DodgerBlue;
int   alpha     = mitigated ? 10 : 25;

Draw.Rectangle(this, zoneTag, false,
    zoneStartBarsAgo, zoneTop,
    0,                zoneBottom,
    fillBrush, fillBrush, alpha);
Same tag, different brush. The rectangle updates in place with the new colors. Mitigation state is just a bool you compute from current price vs zone bounds.
🗑️ Removing Zones
When a zone invalidates completely — fully filled, passed through, expired — remove it from the chart with RemoveDrawObject(tag):
if (zoneFullyFilled)
{
    RemoveDrawObject(zoneTag);
    // also remove the tag from whatever collection tracks active zones
}
A removed tag is gone — calling Draw.Rectangle with the same tag later creates a new rectangle, not an update. If you might want to restore a removed rectangle, consider recoloring to a very transparent brush instead of removing.
🛠️ The Anchor Example — A Simple FVG Indicator
A minimal Fair Value Gap detector. On every closed bar, check for a 3-bar FVG pattern. Draw a rectangle for each. When price later enters the zone, recolor. When price traverses completely, remove.
private HashSet<string> activeZones = new HashSet<string>();

protected override void OnBarUpdate()
{
    if (CurrentBar < 2) return;

    // Detect bullish FVG: High[2] < Low[0]
    if (High[2] < Low[0])
    {
        string tag = "fvg_" + CurrentBar;
        double top = Low[0];
        double bot = High[2];

        Draw.Rectangle(this, tag, false, 2, top, 0, bot,
                       Brushes.DodgerBlue, Brushes.DodgerBlue, 25);
        activeZones.Add(tag);
    }

    // Update each active zone's right edge + mitigation state.
    foreach (string tag in activeZones.ToList())
    {
        // (real implementation: track each zone's bounds in a dictionary,
        //  check current bar's price, redraw or remove accordingly)
    }
}
The pattern scales to any zone-drawing indicator: a HashSet<string> of active tags, parallel per-zone state stored in a Dictionary<string, (double top, double bot)>, per-bar iteration to update or remove.
📝 Pitfalls Checklist
- Using
CurrentTimeorDateTimefor the tag. Inconsistent across chart reloads.CurrentBar-stamped tags are stable and debuggable. - Drawing on every tick without thinking about Calculate mode. On
OnPriceChange/OnEachTick, a condition that flips within a bar creates and removes zones mid-bar. Combine with the cleanup pattern from Week 3 or evaluate only on first tick of bar. - Same tag with different coordinates per bar unintentionally updates. If your tag isn’t unique per zone, a later zone’s draw call silently overwrites the earlier one.
- Rectangle draws that flicker on live ticks when the condition flips. Handle mid-bar state changes explicitly, as covered in Weeks 2 and 3.
- Running out of draw objects. NinjaTrader caps draw objects per indicator. On busy charts with hundreds of detected zones, old ones should be removed when they invalidate — otherwise the limit trips and newer zones don’t render.
- Storing zone bounds in scalar fields instead of a dictionary. You can only track one zone at a time. Real zone indicators need per-tag state.


