Debugging is one of the most underrated skills when it comes to writing NinjaScript indicators. You can have the cleanest code in the world, but if the logic isn’t behaving how you expect—or worse, it’s silently failing—you’ll find yourself stuck staring at a chart wondering what went wrong.
In NinjaTrader, debugging isn’t quite the same as it is in traditional development environments. You don’t have full access to a real debugger unless you attach Visual Studio, and many developers rely heavily on the Print() statement to track what their scripts are doing behind the scenes. While that works, there’s a smarter way to go about it.
In this post, we’re going to walk through practical, real-world ways to debug your NinjaScript indicators—from simple output tricks to using chart visuals, structured print logic, and even Visual Studio breakpoints. Whether you’re just getting started or you’ve written dozens of indicators, these tips will help you solve problems faster and write more reliable code.
👉 Save this official NinjaTrader Help Guide link:
- Print() – NinjaTrader Help Guide
- Log() – NinjaTrader Help Guide
- Alert() – NinjaTrader Help Guide
- Drawing – NinjaTrader Help Guide
- Visual Studio Debugging – NinjaTrader Help Guide
📚 Related NinjaScript Lessons So Far
If you’re new here, make sure you check out the earlier posts too:
- Understanding the NinjaTrader Indicator Structure
- Variables and Properties in NinjaScript
- OnStateChange() Lifecycle Explained
- OnBarUpdate() Fully Explained
- Learn how to use Series<T>
- Learn NinjaScript Plots
- Learn NinjaScript Lines
- How to use NinjaScript Brushes
- Creating and Using Methods & Functions
- Add-On Your Way to Cleaner Code
- Using Lists, Dictionaries, and Arrays
- Creating and Using Classes Inside an Indicator
- Drawing on the Chart with Draw Objects
- Alerts, PlaySound, and Rearm Control
- Create and Use Custom Enums
- Booleans, If Statements, and Conditions
- Loops (For, While, Foreach)
- Try/Catch and Basic Error Handling
🧰 How You Can Debug in NinjaTrader — All the Tools That Actually Help
NinjaTrader doesn’t give you a big red “Run Debugger” button like other platforms. But that doesn’t mean you’re flying blind. It gives you several tools that—when used the right way—can show you exactly what your code is doing, when it’s doing it, and where it’s failing.
Some tools give you written output. Others work visually. And a few help you track down edge cases or misfires that only happen once. Let’s walk through them with real-world use in mind.
🖨️ Print() — Your Day-One Debugging Friend
This is where almost everyone starts, and for good reason: Print() is fast, easy, and tells you exactly what your code is doing in real time.
Want to know if your condition is firing?
if (Close[0] > Open[0])
    Print("Bullish bar at: " + Time[0]);
Want to make sure your logic is even being hit?
Print("OnBarUpdate() running at bar: " + CurrentBar);Want to know which data series is executing?
Print("BIP: " + BarsInProgress + " | Time: " + Time[0]);You’ll use Print() more than you think—especially when debugging conditions that don’t throw errors but quietly don’t behave the way you expect. Just remember: it all goes to the Output window, so keep it open and don’t let it flood.
🪵 Log() — For When You Don’t Want Noise but Still Want Answers
The Log() method is great when you want to track one-time issues, like missing data series or failed setup steps—without blowing up the Output window.
Example:
if (BarsArray[1].Count == 0)
    Log("Secondary series failed to load", LogLevel.Warning);
You’ll see this in the Control Center, Log tab in NinjaTrader. It’s quiet, controlled, and useful for edge cases, especially those that happen during startup or only once.
Use it to:
- Confirm that data series loaded
- Flag broken state transitions
- Quietly capture config issues without distracting from live prints
🎨 Chart-Based Debugging — Visuals That Show You What’s Really Happening
Sometimes, printing to the Output window just isn’t enough. You might need to see when and where something fired. That’s where chart-based debugging comes in.
You’ve got a few powerful options here, and they all show up directly on the chart:
Draw.Text()— Label bars with values, tags, or step markersDraw.Dot(),Draw.ArrowUp()— Show where signals or logic firedBackBrush— Change the background color to signal an eventPlotBrushes[]orBarBrushes[]— Color plots or bars based on your logic
Let’s say you’re calculating a custom value and want to verify it over time:
Draw.Text(this, "val" + CurrentBar, MySeries[0].ToString("0.00"), 0, Low[0] - TickSize, Brushes.White);Or maybe you’re testing a signal condition and want to visually mark the bars where it triggers:
if (myCondition)
    Draw.Dot(this, "dot" + CurrentBar, false, 0, Low[0] - 2 * TickSize, Brushes.LimeGreen);
Want to color the whole background when something major happens?
if (myCondition)
    BackBrush = Brushes.DarkRed;
These tools are invaluable when your plot isn’t showing and you don’t know why, or when you want to visually track your logic through the chart bar-by-bar.
🚨 Alert() — Make NinjaTrader Yell at You (In a Good Way)
If you need NinjaTrader to tell you something right now, and you don’t want to stare at the chart or Output window, use Alert().
Example:
if (CrossAbove(SMA(Close, 10), SMA(Close, 20), 1))
    Alert("Crossover", Priority.High, "10/20 SMA Crossover", "Alert1.wav", 10, Brushes.Yellow, Brushes.Black);
This creates a popup and plays a sound when your condition fires. It’s especially useful in real-time testing or live environments when you want confirmation but can’t watch every tick.
🧵 Visual Studio (For When You’re Truly Stuck)
Most of the time, Print(), Draw.Text(), and colored backgrounds are enough to debug your indicator. But if you’re working on a complex strategy, using external classes, or dealing with C# exceptions that don’t make sense—you can attach Visual Studio to NinjaTrader and use a real debugger.
That means:
- Breakpoints
- Variable inspection
- Step-through execution
It takes a few minutes to set up and is overkill for 90% of scripts—but it’s a lifesaver when needed.
So Which Tool Should You Use?
That depends entirely on what you’re trying to debug:
| Problem | Use This |
|---|---|
| “Is this line even running?” | Print() |
| “This only happens once during startup.” | Log() |
| “I need to see values on the chart.” | Draw.Text(), Draw.Dot(), BackBrush |
| “I want a sound/pop-up when something triggers.” | Alert() |
| “I’m debugging a crash or exception.” | Visual Studio |
Now that you know what tools you can use, let’s go over how to place them based on when NinjaTrader actually runs your code—because if you put a Print() in the wrong place, you’ll never see it.
🧭 Where Should You Start Debugging in a NinjaScript Indicator?
If your indicator isn’t doing what you expect, the hardest part isn’t writing a fix—it’s knowing where to even begin.
NinjaScript runs different parts of your code at different times (OnBarUpdate(), OnStateChange(), OnRender(), etc.). But that doesn’t mean you need to learn the whole system.
Here’s how to choose the right starting point—based on what you’re seeing (or not seeing)—and where to put your debug code.
✅ Start in OnBarUpdate() — This Is Your First Stop
If your plots aren’t showing, your signals aren’t firing, or your draw objects aren’t appearing… start here. This is the method that runs once per bar (or tick), and it’s where most of your logic should live.
Drop this in first (there are more examples in the section below):
protected override void OnBarUpdate()
{
    Print("OnBarUpdate: " + Time[0]);
}
If you see output, your indicator is actively running. Now you can debug conditions, values, or logic flow line by line.
If you don’t see anything print, your code isn’t making it that far. Time to move one layer up…
🧱 If OnBarUpdate() Doesn’t Fire, Check OnStateChange()
If NinjaTrader isn’t reaching your main logic, it probably never finished loading the indicator. To check that, go to OnStateChange() and drop in:
protected override void OnStateChange()
{
    Print("State: " + State.ToString());
}
You should see:
State: SetDefaults
State: Configure
State: DataLoaded
If you don’t see DataLoaded, NinjaTrader bailed during initialization—maybe because of:
- A bad
AddDataSeries()call - A missing or misconfigured plot
- No historical bars loaded
Fixing that first is important—nothing else will work until NinjaTrader fully loads the script.
🧠 Pro tip: Even advanced devs use this line to troubleshoot indicators that silently fail to initialize.
🖼️ If Logic Runs But Nothing Shows: Use Visual Debugging
When your logic is firing but you don’t see anything on the chart, it’s time to move into chart-based debugging.
Add this inside OnBarUpdate():
Draw.Text(this, "val" + CurrentBar, Close[0].ToString("0.00"), 0, Low[0] - TickSize, Brushes.White);Now you’ll see the value printed directly under the bar. If your condition should fire but nothing happens, try this:
if (myCondition)
    Draw.Dot(this, "dot" + CurrentBar, false, 0, Low[0] - 2 * TickSize, Brushes.Lime);
These visuals tell you:
- If your logic is firing on the right bar
- If your condition is skipping bars unintentionally
- Whether your plots are being calculated correctly (even if not plotted)
This is the fastest way to bridge the gap between “code is running” and “something is showing.”
🧵 Don’t Start in OnRender() Unless You Know Why
You should only look at OnRender() if:
- You’ve written custom rendering code
- You’re drawing lines, regions, or text using
SharpDX - Your visuals are complex and not showing up as expected
Most indicators never touch this method—so if you’re not overriding it yourself, you can skip it.
If you are debugging inside OnRender(), use Draw.Text() or a Print() in OnBarUpdate() first to confirm your data is valid before blaming render code.
🧭 Where to Start — Based on What You’re Seeing
| What You See | Where to Start Debugging |
|---|---|
| Absolutely nothing | OnStateChange() → check for DataLoaded |
| Code loads, but nothing fires | OnBarUpdate() → drop a basic Print() |
| Values update, but chart shows nothing | Add Draw.Text() or Draw.Dot() in OnBarUpdate() |
| You're drawing with custom rendering code | Check OnRender() (but only if you wrote in it) |
This isn’t about memorizing method names—it’s about knowing where to stick your first debug statement and what it’ll tell you.
From here, you can move into debugging specific issues—like conditions that never trigger or plots that fail silently.
🖨️ Deep Dive: Using Print()
Print() is the most basic, accessible, and powerful debugging tool in NinjaScript. It doesn’t require setup, doesn’t crash your platform, and gives you immediate feedback on what your code is doing.
But too many traders use it incorrectly—or barely scratch the surface of what it’s capable of.
This section shows you how to use Print() the right way, from your very first line to structured outputs that help you debug conditions, cross-check logic, and isolate silent failures across multi-series scripts.
🧠 Why You Should Use Print()
In traditional software development, developers use debuggers to pause execution, step through code, and inspect values. But in NinjaTrader, especially when running historical data or testing in real time, you don’t have that luxury unless you’re using Visual Studio.
So how do you find out what’s going on under the hood?
You print it.
Print() lets you:
- Confirm whether a block of code is running
- Check the value of a variable at a specific bar
- Inspect what’s happening inside a condition
- Determine which BarsInProgress stream is executing
- Identify subtle logic bugs that don’t throw errors
And you can do all of that without leaving the chart.
🔌 Where Does Print() Go?
You’ll usually place it in:
OnBarUpdate()— for checking logic that runs per bar or tickOnStateChange()— for confirming script load phases- Inside custom methods — for testing how helper functions behave
- Inside
iforelsebranches — to see why a condition passed or failed
💡 If you’re not seeing anything print to the Output window, your code might not be running. Start by dropping a Print("Test") in OnBarUpdate() to confirm basic execution.
🪜 From Basic Prints to Structured Debug Output
✅ Step 1: Confirm execution
If you’re not sure your code is running:
Print("✅ Reached OnBarUpdate at " + Time[0]);You’ll know for sure that the script is hitting OnBarUpdate() and when.
✅ Step 2: Check a variable’s value
Print("SMA(10): " + SMA(Close, 10)[0]);Need to check two values?
Print("Close: " + Close[0] + " | Open: " + Open[0]);Need more structure?
Print($"[{CurrentBar}] {Time[0]} | Close: {Close[0]} | SMA: {SMA(Close, 10)[0]}");This gives you time, bar index, and values—all in one line.
🔄 Use Cases: Print() in Real Life
Let’s walk through common scenarios where Print() is essential.
🔍 “Is my code running at all?”
protected override void OnBarUpdate()
{
    Print("Running at: " + Time[0]);
}
If you don’t see this output, your script might not be loading fully (check OnStateChange() next).
⚖️ “Why isn’t my condition firing?”
Let’s say your condition isn’t doing what you expect:
if (Close[0] > Open[0])
{
    // Expect this to trigger on bullish bars
    Print("✅ Bullish bar at: " + Time[0]);
}
else
{
    Print("⛔ Not a bullish bar at: " + Time[0] + " | Close: " + Close[0] + " | Open: " + Open[0]);
}
Now you’ll see the actual values that are failing your logic.
🧩 “Which BarsInProgress is running?”
This is huge when working with multi-timeframe scripts:
Print("Bar: " + CurrentBar + " | BIP: " + BarsInProgress + " | Time: " + Time[0]);You’ll often discover that your logic is running on the wrong series—or not running on your secondary series at all.
⏱️ “Did this condition ever fire during this test?”
Print with a filter:
if (CrossAbove(SMA(Close, 10), SMA(Close, 20), 1))
{
    Print("✅ Crossover at bar " + CurrentBar + " | Time: " + Time[0]);
}
You’ll see exactly when and how often it triggered across your chart.
📋 Formatting Tips That Save Time
- Include
CurrentBarandTime[0]in every debug line - Always include
BarsInProgressin multi-series scripts - Use
ToString("0.00")to keep decimal values readable - Separate values with
|for quick scanning in Output window
Example:
Print($"[{CurrentBar}] {Time[0]} | BIP: {BarsInProgress} | Fast: {fast[0]:0.00} | Slow: {slow[0]:0.00}");🧼 Avoiding Output Window Overload
The NinjaTrader Output window can only handle so much. Too many lines too fast and it will:
- Freeze
- Lag the platform
- Stop displaying new prints
How to keep it clean:
- Print only every X bars:
if (CurrentBar % 10 == 0)
Print("Bar " + CurrentBar);- Use a boolean toggle:
if (ShowDebug)
Print("Debug Info: " + Close[0]);- Remove or comment out Print lines when you’re done debugging
- Don’t leave Print in production-level scripts—it slows performance
If you don’t want your debug visuals to stack up every time the script reloads:
if (State == State.DataLoaded)
    ClearOutputWindow();
🧠 Bonus: Print Smart, Not More
Here are advanced tricks that help you debug smarter:
✅ Compare before and after logic values:
double prior = mySeries[1];
double current = mySeries[0];
Print($"Before: {prior} | After: {current} | Diff: {current - prior}");
✅ Use emojis or tags to flag prints
Print("⚠️ Reversal triggered at " + Time[0]);That makes key lines easier to spot in a wall of output.
❌ Common Print() Mistakes to Avoid
| Mistake | Problem | Fix |
|---|---|---|
| Print("Condition fired"); | No context—when? where? | Add Time[0], BIP, and variable values |
| Printing on every bar | Floods Output window | Throttle with CurrentBar % X == 0 |
| Using Print() in OnRender() | Doesn’t run reliably | Stick to OnBarUpdate() or helper methods |
| Forgetting to remove after testing | Slows code & clutters logs | Clean up once done |
💬 Recap
Print() is your first, fastest, and often best way to understand what’s happening inside your NinjaScript. But it’s only as useful as the info you include.
Use it to:
- Confirm your code is running
- Track variables and logic behavior
- Debug execution order and multi-series issues
- Build a step-by-step view of your script in action
Always include context:
Time[0]CurrentBarBarsInProgress- Variable values
🪵 Deep Dive: Using Log()
Print() is perfect when you’re actively watching your script run and want constant feedback. But sometimes, you only care about rare conditions—things that happen once, during startup, or under edge cases.
That’s where Log() shines. It lets you report problems, track state, and surface important messages—without cluttering your Output window or slowing down your platform.
🧠 What Is Log()?
The Log() method writes a message to the Control Center, Log tab in NinjaTrader. It can be configured with different severity levels (e.g., info, warning, error), and doesn’t overwhelm your system like Print() can if called repeatedly.
Think of it as a quiet alert system for unusual or important events.
✅ When to Use Log() (Instead of Print())
Use Log() when:
- A condition should only happen once, and you want to track it
- You’re debugging script loading or state transitions
- You want to report config problems to the user (like missing series or settings)
- You need to debug something that fails silently
- You’re trying to keep the Output window clean, but still want info
🧪 Real-World Scenarios
🔄 Detecting failed data series setup
if (BarsArray.Length < 2 || BarsArray[1].Count == 0)
    Log("Secondary series failed to load", LogLevel.Warning);
You won’t see this in the Output window—but it’ll show up in the Log tab, exactly once.
🧱 Catching failed state transitions
Let’s say you expect to hit State.DataLoaded, but don’t:
if (State == State.Configure && BarsArray.Length < 2)
    Log("Expected AddDataSeries() setup failed — no secondary data.", LogLevel.Error);
This is huge when debugging why your indicator never hits OnBarUpdate().
🧰 Reporting config mistakes
Maybe a user forgot to set a required property:
if (MyLookback < 1)
    Log("Invalid Lookback setting: Must be >= 1", LogLevel.Error);
Use this instead of crashing the script or silently failing. It also respects NinjaTrader’s logging levels and helps with debugging user settings.
🧾 Log Syntax & Severity Levels
Log("Message", LogLevel.Info);      // General info
Log("Message", LogLevel.Warning);   // Something might go wrong
Log("Message", LogLevel.Error);     // Something definitely went wrong
Where it shows up:
- Log tab (bottom of NinjaTrader terminal)
- Log file (in case you need to send to support)
- Does not appear on chart or Output window
📏 Formatting for Readability
Use the same formatting approach you use with Print():
Log($"[{CurrentBar}] BIP: {BarsInProgress} | Data series not loaded", LogLevel.Warning);You can include:
CurrentBarBarsInProgressTime[0](if you know you’re inOnBarUpdate())
Just avoid printing every bar—Log() should only fire when something meaningful happens.
🧼 Best Practices for Using Log()
| Do This | Not This |
|---|---|
| Log one-time setup failures | Don’t log every bar |
| Include bar/time context if possible | Don’t be vague ("Something went wrong") |
| Use LogLevel.Warning or Error when needed | Don’t log everything at Info level |
| Combine with conditional logic to reduce noise | Don’t log things you already Print |
🚧 Common Mistakes
| Mistake | What Happens |
|---|---|
| Logging inside OnBarUpdate() unconditionally | Massive spam in Log tab and potential lag |
| Using Log() when Print() is better | You won’t see real-time updates |
| Not checking Log tab when debugging init bugs | You’ll miss critical info if you only watch Output |
🤝 How It Plays with Print()
Think of Log() as the whisper to Print()’s shout.
You can use both in the same script, like this:
if (BarsInProgress == 1 && BarsArray[1].Count == 0)
{
    Print("Secondary series is empty — this is a problem.");
    Log("BarsArray[1] had 0 bars at DataLoaded", LogLevel.Warning);
}
This way you can:
- Watch real-time debugging in Output
- Leave a permanent note in the Log tab for post-run review
💬 Summary
Use Log() when you need to:
- Debug problems that only happen once
- Catch failed state transitions
- Track misconfigurations
- Keep long-running debug notes without output spam
It’s your low-noise, high-signal debugging tool—and complements Print() perfectly.
🎨 Deep Dive: Chart-Based Visuals
When Print() tells you that something happened—but you need to see when and where it happened—chart-based debugging is your best friend.
This is especially useful for:
- Confirming your logic on historical bars
- Visually validating signals and calculated values
- Debugging plot behavior or misalignment
- Understanding bar-by-bar how your script is progressing
Instead of digging through lines in the Output window, you can just look at your chart and see what your indicator is doing.
🧠 Why Use Chart-Based Debugging?
Because visuals are faster to interpret than text.
You can:
- Show exact bars where conditions fire
- Plot calculated values that don’t render normally
- Visually track whether your logic “misses” expected setups
- Confirm your series are aligned or firing as expected
- Debug in real-time or on historical data
Chart-based tools persist on the chart, so you can scroll back, look over your logic, and instantly spot gaps or misfires.
🛠️ Tools You’ll Use
| Tool | What It Does |
|---|---|
| Draw.Text() | Writes custom text on a specific bar |
| Draw.Dot() / Draw.ArrowUp() | Marks bars with symbols for visual tracking |
| BackBrush | Colors the background of the chart on specific bars |
| PlotBrushes[] / BarBrushes[] | Colors your plots or price bars |
| Draw.Region() | Visualizes ranges between two plots |
| Draw.Line() | Shows calculated support/resistance or debug values |
We’ll cover the most practical ones below.
✍️ Draw.Text() – Show Values Directly on the Chart
Want to know what your custom series is doing?
Draw.Text(this, "debug" + CurrentBar, MySeries[0].ToString("0.00"), 0, Low[0] - TickSize, Brushes.White);✅ Tip: Include CurrentBar in the tag so the text is unique per bar—otherwise it’ll overwrite itself.
Use this to:
- Show the value of a calculation
- Confirm logic without a plot
- Annotate bars where conditions are met
📍 Draw.Dot() – Mark Signal Bars Visually
Need to know when a condition fired?
if (myCondition)
    Draw.Dot(this, "dot" + CurrentBar, false, 0, Low[0] - 2 * TickSize, Brushes.Lime);
Also try:
Draw.ArrowUp(this, "signal" + CurrentBar, false, 0, Low[0] - 2 * TickSize, Brushes.Green);You’ll see exactly which bars triggered the logic.
🎨 BackBrush – Highlight Entire Bars
Want to color the entire chart background when something happens?
if (myCondition)
    BackBrush = Brushes.DarkRed;
Perfect for:
- Reversal zones
- Trend breaks
- Setup windows
- Identifying major logic events
📈 PlotBrushes[] – Debug Plot Appearance
If your plot looks wrong—or doesn’t show at all—try coloring it per condition:
if (myCondition)
    PlotBrushes[0][0] = Brushes.Magenta;
Also works for price bars:
if (myCondition)
    BarBrushes[0] = Brushes.LightBlue;
This tells you:
- Whether the plot is being set
- When it’s updating
- If your logic is skipping bars
📊 Draw.Region() and Draw.Line()
Less common, but useful for visualizing value bands or expected levels.
Draw.Line(this, "line" + CurrentBar, false, 10, 4000, 0, 4100, Brushes.Gray);
Draw.Region(this, "region" + CurrentBar, 0, UpperSeries, LowerSeries, null, Brushes.LightGray, Brushes.Transparent, 50);
Use it to test boundaries, spreads, or value zones.
📋 Debugging Examples with Visuals
🧪 Condition should fire but doesn’t?
if (myCondition)
{
    Draw.Dot(this, "dot" + CurrentBar, false, 0, Low[0] - 2 * TickSize, Brushes.LimeGreen);
}
else
{
    Draw.Text(this, "missed" + CurrentBar, "Not met", 0, High[0] + 2 * TickSize, Brushes.Red);
}
📈 Your plot isn’t showing?
Draw.Text(this, "val" + CurrentBar, MySeries[0].ToString("0.00"), 0, Low[0] - TickSize, Brushes.White);
PlotBrushes[0][0] = Brushes.Yellow;
This helps isolate:
- Is the value
NaN? - Is it not being set at all?
- Is the brush being applied but nothing shows?
🚨 Mistakes to Avoid
| Mistake | Problem |
|---|---|
| Reusing draw tags (no + CurrentBar) | Only one visual shows; everything else is overwritten |
| Not removing visuals on reload | Chart becomes cluttered and unreadable |
| Using BackBrush without condition guards | Entire chart turns red and you don't know why |
| Overwriting plot colors unintentionally | Can make real plots disappear visually |
💡 Bonus: Combine with Print()
You can visually mark a bar and print data at the same time:
if (myCondition)
{
    Draw.Dot(this, "dot" + CurrentBar, false, 0, Low[0] - 2 * TickSize, Brushes.Lime);
    Print("Fired on: " + Time[0] + " | Value: " + MySeries[0]);
}
💬 Summary
Chart-based debugging is your bar-by-bar, visual truth-teller. Use it when you:
- Want to confirm your logic visually
- Need to debug plots that silently fail
- Are building something complex and want to see the logic unfold
It turns your indicator into a real-time visual log, right on the price chart—no Output window required.
🚨 Deep Dive: Alert()
Sometimes you don’t have time to scroll through the Output window… or maybe your visual debug objects aren’t obvious enough. That’s where Alert() steps in. It grabs your attention with a sound, a pop-up, and even optional chart visuals—right when your condition fires.
If Print() is for development and Draw() is for review, then Alert() is for in-the-moment awareness.
💬 Author’s Note:
While Alert() can be used for debugging—and I’ve included it here for completeness—I personally don’t use it in that way. If I ever needed that kind of real-time notification or event confirmation during development, I’d rather attach the Visual Studio debugger and step through the logic directly. For me, Alert() is better reserved for production-time user feedback, not development-time issue tracking.
🔔 What Is Alert()?
The Alert() method in NinjaScript triggers a popup, optionally plays a sound, and can apply highlighting to a bar when a condition is met.
It’s best used for:
- Debugging live or in real-time playback
- Getting confirmation that a condition fired without babysitting the chart
- Creating debugging pings for things that shouldn’t happen
📦 Alert Syntax
Alert(string id, Priority priority, string message, string soundFile, int rearmSeconds, Brush backgroundColor, Brush textColor);Example:
if (CrossAbove(SMA(Close, 10), SMA(Close, 20), 1))
{
    Alert("smaCross", Priority.High, "SMA 10/20 Crossover Triggered", "Alert1.wav", 10, Brushes.Yellow, Brushes.Black);
}
🧠 Why Use Alert() for Debugging?
Because it can do three things that no other method can at the same time:
- Make a noise (when you’re doing something else)
- Show a popup with a message
- Highlight the bar with colors
That makes it perfect for catching rare, but important logic issues—especially when running in playback or live market mode.
🧪 Use Cases for Debugging
📢 Confirm Signal Conditions Are Firing
if (mySignal)
    Alert("debugSignal", Priority.Medium, "Signal fired at: " + Time[0], "Alert3.wav", 5, Brushes.LightGreen, Brushes.Black);
✅ Use this when you’re testing a new condition that should be triggering but isn’t.
🕵️♂️ Catch Setup Errors or Invalid States
if (MySeries.IsValidDataPoint(0) == false)
    Alert("badData", Priority.High, "Series data invalid!", "Alert4.wav", 15, Brushes.Red, Brushes.White);
🔍 Useful when debugging why your plots are failing silently.
🚨 Combine with Visuals
You can layer Alert() with a Draw.Dot() or BackBrush so the event is logged, heard, and seen:
if (myCondition)
{
    Alert("debugCombo", Priority.High, "Important event", "Alert2.wav", 10, Brushes.Orange, Brushes.Black);
    Draw.Dot(this, "dot" + CurrentBar, false, 0, Low[0] - TickSize, Brushes.OrangeRed);
}
🧰 Rearm Seconds — Don’t Spam Yourself
The rearmSeconds parameter prevents the alert from firing again within that time window. Use it wisely:
- 0 = fires on every bar (dangerous)
- 5–15 = good for real-time scalping/debugging
- 30+ = for rare event tracking
Example:
Alert("watchlistOverflow", Priority.High, "Watchlist count exceeded", "Alert5.wav", 60, Brushes.Yellow, Brushes.Black);⚠️ What Can Go Wrong
| Mistake | Consequence |
|---|---|
| No rearmSeconds throttle | Alerts every bar → spam overload |
| Using vague id values | Alert won’t fire twice on same ID |
| Using during State.Configure | Can throw errors or do nothing |
| Forgetting the sound file | Alert works silently, and you might miss it |
✅ Use unique ids like "signal" + CurrentBar or just rotate IDs if debugging.
💡 Pro Tips
- Test your alert without sound first—make sure logic works
- Use
"Alert1.wav"or"Alert2.wav"—they’re built into NinjaTrader - Alerts are non-blocking: they won’t pause code, so chain other debug tools if needed
- You can add alerts for internal logic too (not just trade setups)
📊 Bonus: Debugging Strategy Events
Want to confirm your strategy is placing or skipping trades?
if (Position.MarketPosition == MarketPosition.Flat && shouldEnterLong)
{
    Alert("entryBlocked", Priority.High, "Long entry skipped due to flat position", "Alert3.wav", 20, Brushes.Blue, Brushes.White);
}
This works great in combination with Print() for tracking execution state + logic failure.
💬 Summary
Alert() is your real-time notification tool for:
- Live market debugging
- High-priority condition tracking
- Combining logic + visual + sound in one go
Use it when you need to know right now that something important has happened—and don’t want to miss it while scanning bars or scrolling logs.
🧵 Deep Dive: Visual Studio Debugging
Most of the time, Print() and chart visuals will get the job done. But when you’re dealing with something more complex—like null reference crashes, odd state behavior, or debugging custom classes—you’ll want to step through your code like a traditional developer.
That’s where Visual Studio debugging comes in.
🧠 Why Use Visual Studio?
Visual Studio gives you what nothing else can: a real-time, line-by-line view of how your code is executing.
Use it to:
- Set breakpoints to pause execution at specific lines
- Inspect variables as the script runs
- Step line-by-line through
OnStateChange(),OnBarUpdate(), etc. - Catch silent crashes (like null object access or improper state transitions)
Yes, it’s slower to set up—but when you’re stuck, it’s often the only thing that will give you answers.
⚙️ One-Time Setup Checklist
- ✅ Install Visual Studio 2019 or 2022 (Community Edition is free)
- ✅ Make sure Debug Mode is enabled in NinjaTrader
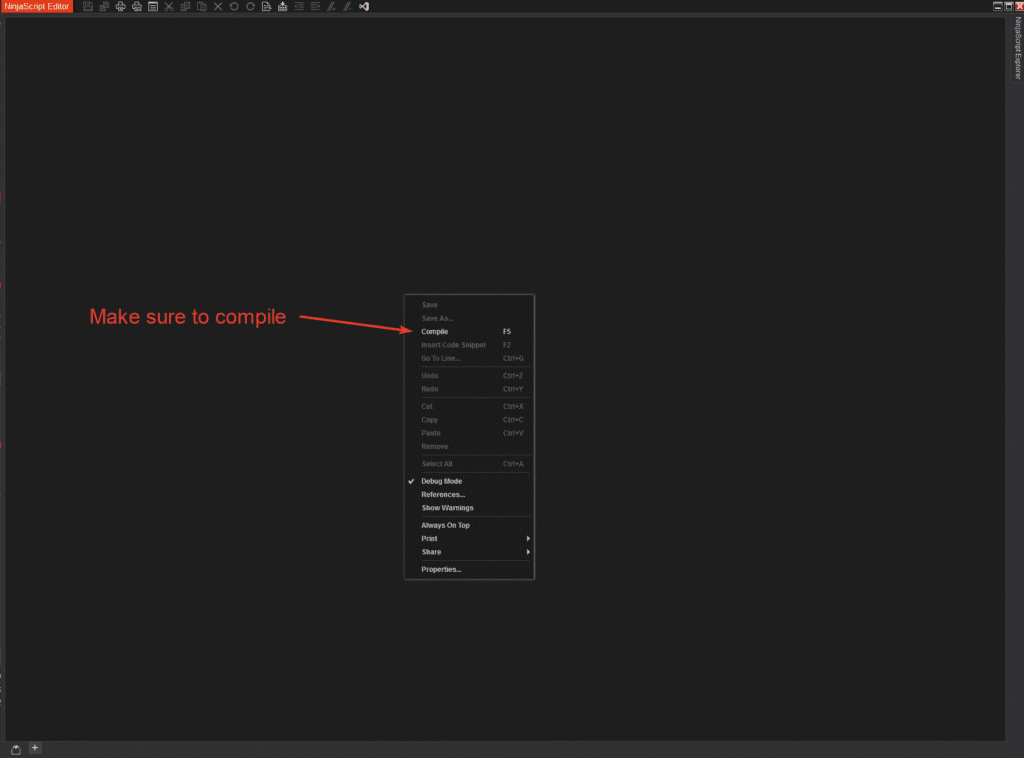
- ✅ Don’t forget to compile from the NinjaScript Editor first—this generates the correct debug DLL
🔄 Step-by-Step: Attaching Visual Studio to NinjaTrader
You can follow this flow every time you want to debug interactively.
🧩 Step 1: Enable Debug Mode
- Open the NinjaScript Editor
- Right-click → Check “Enable Debug Mode”
- Compile once (any script) so NinjaTrader generates the special debug DLL
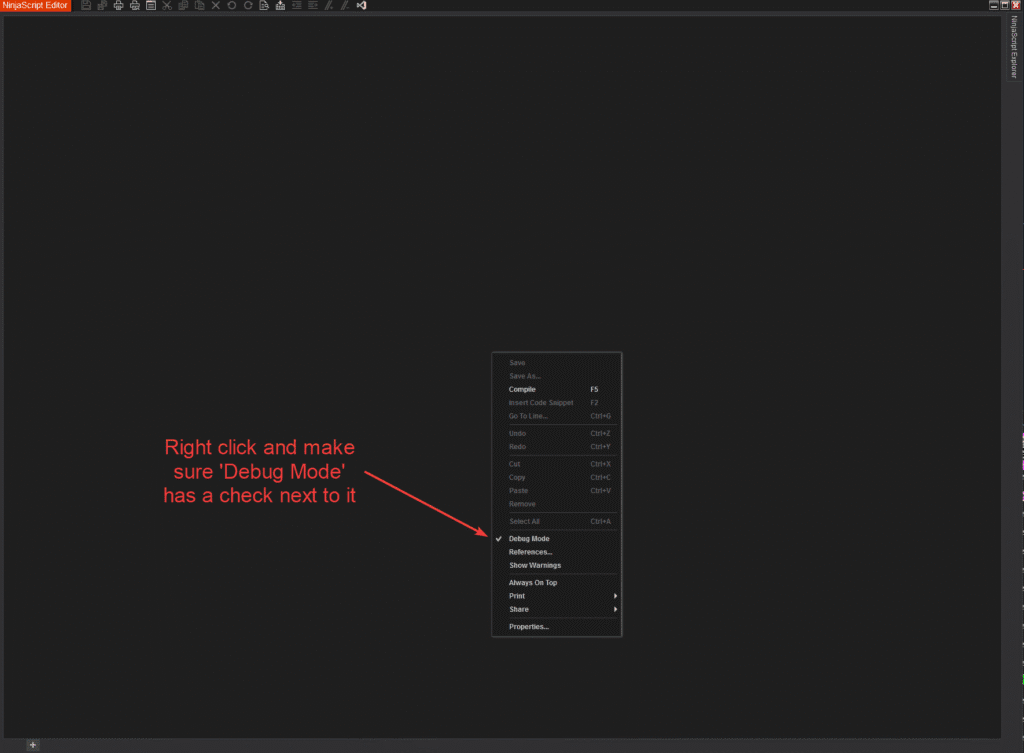
💡 This is important: NinjaTrader compiles your code into NinjaTrader.Custom.dll, and Debug Mode creates a special version with debug symbols so Visual Studio can step through your code.
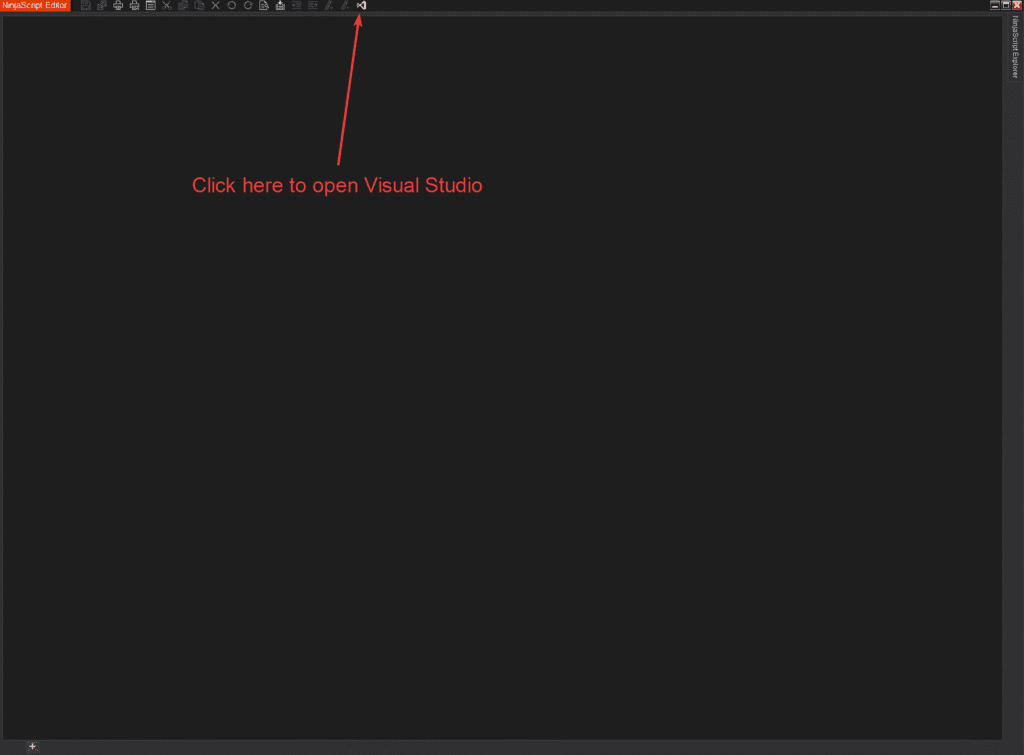
🧩 Step 2: Launch Visual Studio
- In the NinjaScript Editor toolbar, click the Visual Studio icon
- This opens the NinjaTrader.Custom project automatically in Visual Studio
(or, navigate manually toDocuments\NinjaTrader 8\bin\Custom\and openNinjaTrader.Custom.csproj)
🧩 Step 3: Attach to the NinjaTrader Process
In Visual Studio:
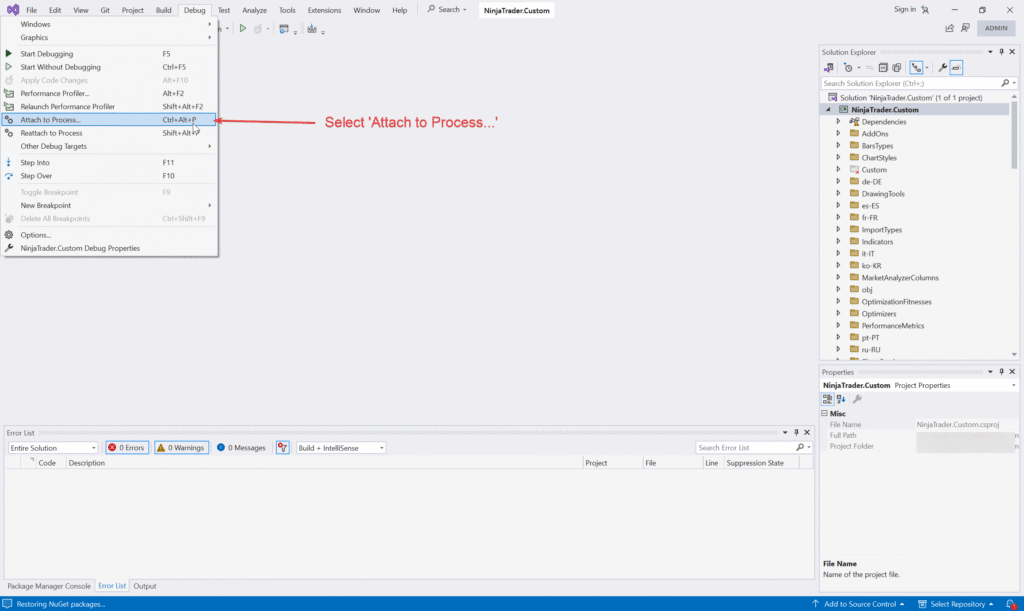
- Go to
Debug→Attach to Process - Select
NinjaTrader.exefrom the list - Click Attach
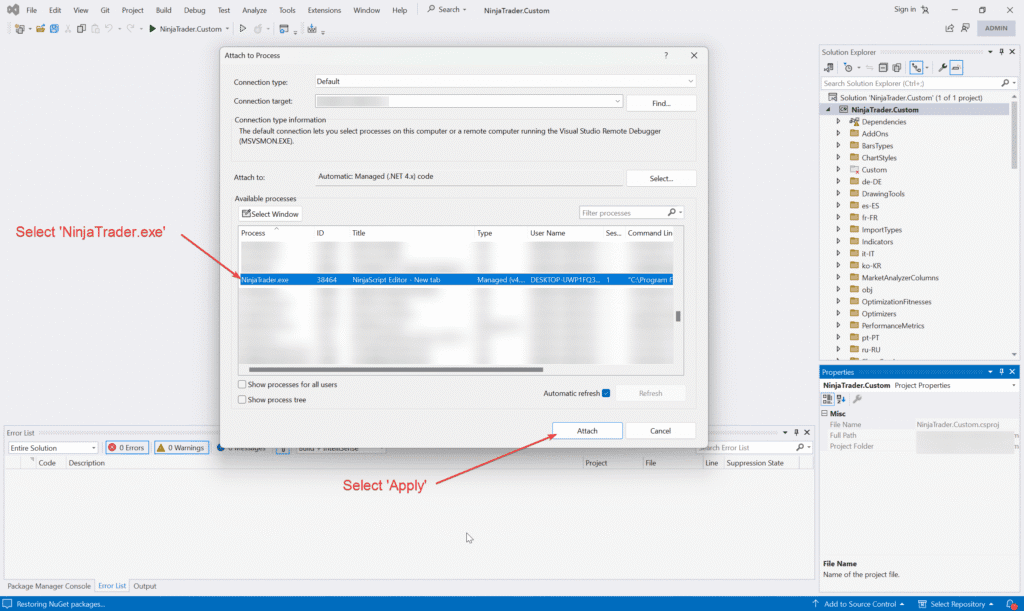
🧠 Make sure “Attach to” is set to “Managed code” or “Automatic: Managed code.”
🧩 Step 4: Set Breakpoints
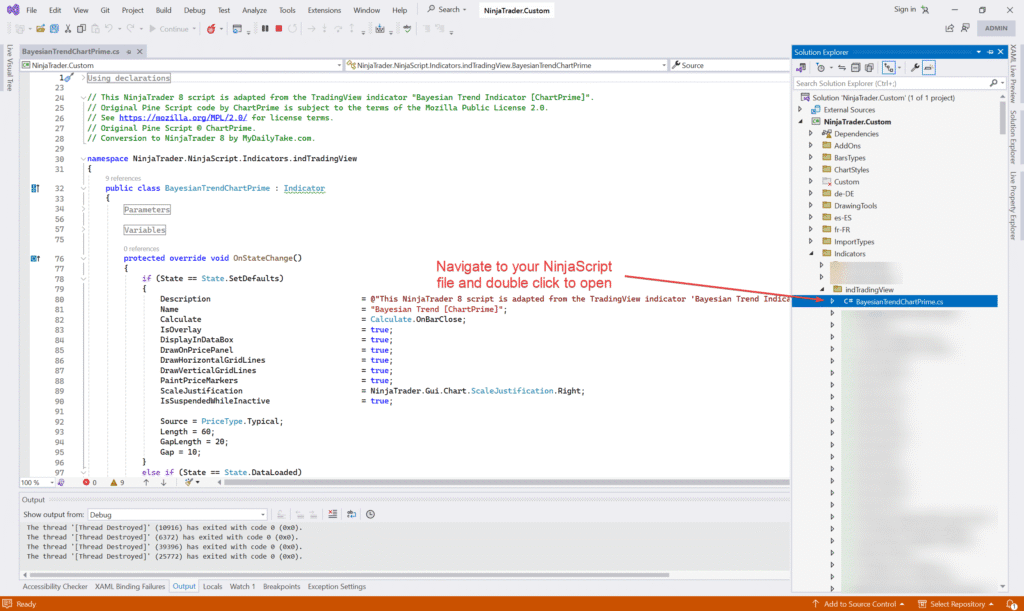
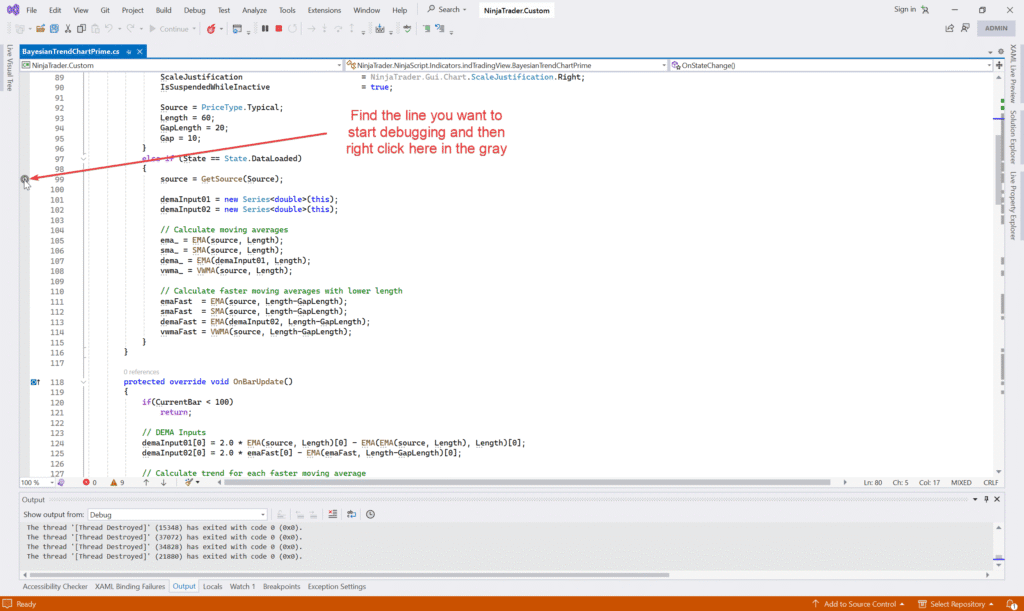
- Open your script in Visual Studio
- Click to the left of any line to set a breakpoint
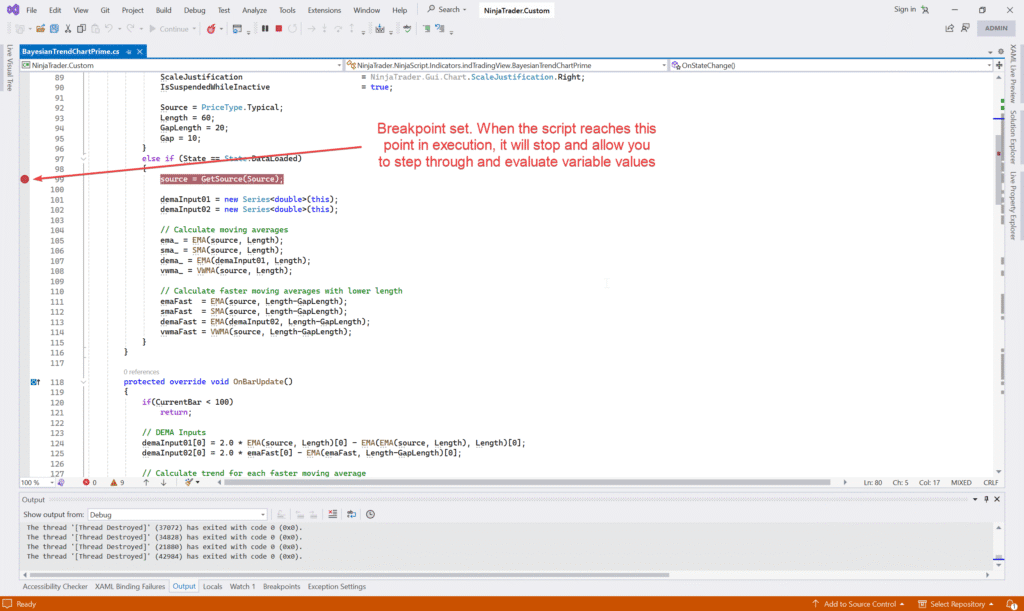
🧩 Step 5: Run Your Indicator in NinjaTrader
Apply your indicator to a chart, run it, and watch Visual Studio pause execution at the breakpoint.
From there, you can:
- Hover over variables to inspect them
- View the call stack
- Step forward or backward
- Understand exactly why and when your logic is running
🧨 Performance & Gotchas
| Issue | Explanation |
|---|---|
| Visual Studio doesn’t stop at breakpoints | You didn’t compile from the NinjaScript editor after enabling Debug Mode |
| “Source Not Available” | You're viewing compiled code with no debug symbols |
| Execution is slow or choppy | That’s normal in Debug Mode—use Calculate.OnBarClose to reduce overhead |
| Breakpoints are skipped | Make sure the NinjaScript was applied to the chart and hit that code path |
🧠 Important: Always disable Debug Mode and recompile when you’re done debugging. This ensures NinjaTrader switches back to the faster, release version of the DLL.
✏️ Author Tip: Use Visual Studio to Edit Too
You can also use Visual Studio as your code editor, even if you’re not debugging. Just make sure to:
- Open the NinjaTrader project (as above)
- Edit and save the file in Visual Studio
- Keep the NinjaScript Editor open in NinjaTrader — your changes will auto-compile as soon as you save
❗ Never build from inside Visual Studio. Let NinjaTrader do the compiling.
💬 Summary
Visual Studio is your best friend when:
- You’re stuck on a crash or silent failure
- You need to trace variable values across multiple bars
- You want to see the exact order of execution in NinjaTrader’s lifecycle
- You’ve tried everything else—and you’re still lost
It’s not for every debug session. But when you need it, nothing else compares.
🧠 Final Thoughts
Debugging in NinjaTrader isn’t about memorizing every lifecycle method or learning every advanced C# feature—it’s about knowing how to observe your code in action and recognize when something doesn’t add up.
Most of the time, you’ll be able to solve a problem with just a few well-placed Print() statements or a Draw.Text() label on the chart. Other times, you’ll need to go deeper—checking OnStateChange() for setup issues, verifying data series load correctly, or even attaching Visual Studio to step through the code line-by-line.
What separates good NinjaScript developers from frustrated ones isn’t perfect code—it’s knowing how to track down the imperfections when the chart doesn’t look right, the plots don’t show, or the logic silently fails.
So the next time you find yourself stuck, go back to the basics:
- Print it.
- Mark it.
- Step through it.
- And when in doubt—start higher in the script and work your way down.
Happy coding 👨💻 and happy debugging 🔍.
🎉 Prop Trading Discounts
💥91% off at Bulenox.com with the code MDT91
