Learn NinjaScript: Building Your First Indicator from Scratch
You’ve read enough of the foundational posts in this series to know what OnBarUpdate, OnStateChange, and Plots do in isolation. This post puts them together. By the end of this walkthrough you’ll have a working NinjaScript indicator on your chart that plots a moving average and recolors itself based on slope — green when it’s rising, red when it’s falling, gold when it’s flat.
I’m using this as the anchor post for the Learn NinjaScript series because every other topic we cover is just a variation on what happens here. If you’re new, start at the top and work down. If you already have a few indicators under your belt, skim it for style — the indicator we’re building is the skeleton I use as a starting template for everything else.
✅ What you need before we start
- NinjaTrader 8, logged in, with any chart open.
- Basic familiarity with the NinjaScript Editor (Tools → NinjaScript Editor, or
New → NinjaScript Editor). - About 20 minutes. Less if you’re a copy-paste kind of person.
If you’ve never looked at the NinjaScript Editor before, open it first and click around. The Indicators folder in the left panel is where your custom code lives — that’s where this is going.
🧙 Step 1: Use the wizard to scaffold the file
Right-click Indicators in the Editor and pick New NinjaScript → Indicator. The wizard asks for three things: a name, a description, and any input parameters. I’m calling this one MyFirstSMA, giving it a one-line description, and adding a single input called Period of type int with a default of 20.
When you click Generate, NinjaTrader writes a full skeleton file for you. Don’t panic at the volume of code — most of it is auto-generated boilerplate at the bottom of the file inside a #region called NinjaScript generated code. Leave that alone. The only parts you’ll touch are OnStateChange, OnBarUpdate, and the property at the top.
If you want to skip the wizard and just paste, the complete file looks like this. Save this as MyFirstSMA.cs inside Documents/NinjaTrader 8/bin/Custom/Indicators if you’d rather do it by hand:
#region Using declarations
using System;
using System.ComponentModel;
using System.ComponentModel.DataAnnotations;
using System.Windows.Media;
using System.Xml.Serialization;
using NinjaTrader.Cbi;
using NinjaTrader.Data;
using NinjaTrader.Gui.Tools;
using NinjaTrader.NinjaScript;
using NinjaTrader.NinjaScript.Indicators;
#endregion
namespace NinjaTrader.NinjaScript.Indicators
{
public class MyFirstSMA : Indicator
{
protected override void OnStateChange()
{
if (State == State.SetDefaults)
{
Description = "A simple moving average that colors itself by slope.";
Name = "MyFirstSMA";
Calculate = Calculate.OnBarClose;
IsOverlay = true;
DisplayInDataBox = true;
DrawOnPricePanel = true;
PaintPriceMarkers = true;
IsSuspendedWhileInactive = true;
Period = 20;
AddPlot(new Stroke(Brushes.DodgerBlue, 2), PlotStyle.Line, "SMA");
}
}
protected override void OnBarUpdate()
{
if (CurrentBar < Period)
return;
double sum = 0;
for (int i = 0; i < Period; i++)
sum += Close[i];
SMA[0] = sum / Period;
if (CurrentBar > Period)
{
PlotBrushes[0][0] = SMA[0] > SMA[1] ? Brushes.LimeGreen
: SMA[0] < SMA[1] ? Brushes.Crimson
: Brushes.Gold;
}
}
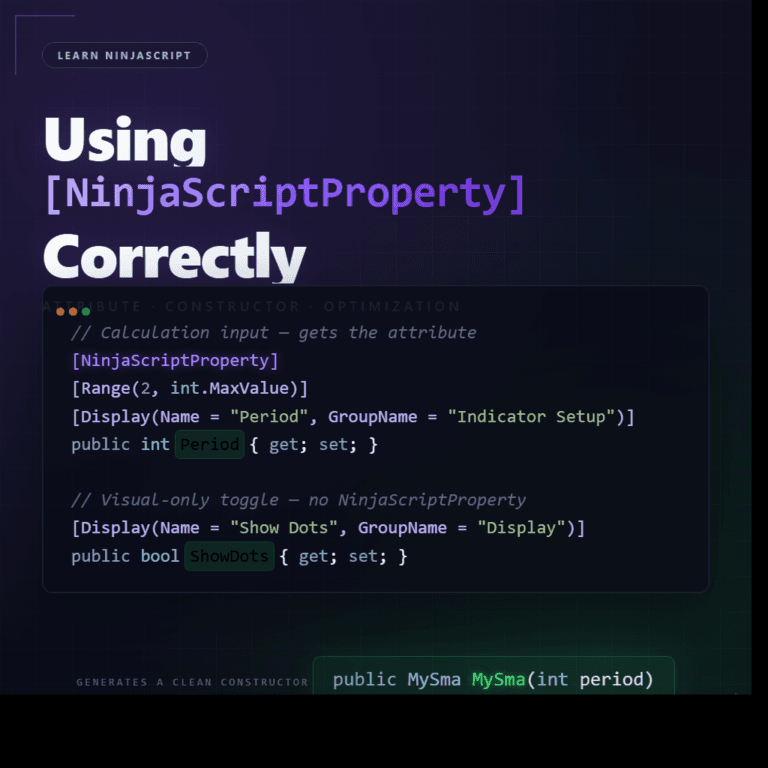
[Range(1, int.MaxValue)]
[NinjaScriptProperty]
[Display(Name = "Period", GroupName = "Parameters", Order = 0)]
public int Period { get; set; }
[Browsable(false)]
[XmlIgnore]
public Series<double> SMA => Values[0];
}
}🔄 Step 2: Understand what OnStateChange is doing
NinjaScript lifecycle is a state machine, and OnStateChange is where you react to each state. The only state we care about in this indicator is SetDefaults — that’s the state where we tell NinjaTrader what this indicator is and how to display it.
if (State == State.SetDefaults)
{
    Description = "A simple moving average that colors itself by slope.";
    Name        = "MyFirstSMA";
    Calculate   = Calculate.OnBarClose;
    IsOverlay   = true;

    Period = 20;

    AddPlot(new Stroke(Brushes.DodgerBlue, 2), PlotStyle.Line, "SMA");
}Three things to note. First, Calculate = Calculate.OnBarClose means OnBarUpdate fires once per bar close. We’ll get to OnEachTick and OnPriceChange later in the series — OnBarClose is the safe default for your first indicator. Second, IsOverlay = true puts the plot on the price panel instead of in a separate panel below. Third, AddPlot(...) is where the actual line gets registered. The Stroke sets the default color and thickness, the PlotStyle.Line picks a line (vs histogram, dot, etc.), and the string "SMA" is the name you’ll see in the data box and the plot dropdowns.
🧮 Step 3: Do the actual math in OnBarUpdate
OnBarUpdate fires once for every bar that goes by — on historical bars when the indicator first loads, and then in real-time as new bars close. The first line is the important one:
if (CurrentBar < Period)
return;You can’t compute a 20-bar average on bar 5. CurrentBar is the zero-indexed count of bars that have already been processed. Returning early when we don’t have enough data is the single most common guard you’ll write in NinjaScript — if you forget it, you’ll see #Value! or get array-out-of-bounds exceptions.
Once we have enough bars, the calculation is a plain sum-and-divide:
double sum = 0;
for (int i = 0; i < Period; i++)
    sum += Close[i];

SMA[0] = sum / Period;Close[0] is the current bar’s close. Close[1] is the previous bar’s close. The loop walks backwards Period bars and adds them up. Assigning to SMA[0] (which is just a shorthand for Values[0][0] — the first plot’s current-bar value) is what makes the point actually draw.
🎨 Step 4: Color the line by slope
This is the part that makes a beginner indicator feel like something you’d actually ship. PlotBrushes[0][0] is “the first plot’s brush on the current bar.” Assigning to it overrides the default color for that single bar:
if (CurrentBar > Period)
{
    PlotBrushes[0][0] = SMA[0] > SMA[1] ? Brushes.LimeGreen
                      : SMA[0] < SMA[1] ? Brushes.Crimson
                                        : Brushes.Gold;
}Why CurrentBar > Period and not >=? Because we need SMA[1] — the previous bar’s SMA — to compare against. On the first bar where the SMA is valid, there isn’t one yet. Off-by-one errors around CurrentBar guards are another thing you’ll hit over and over; when in doubt, check whether every index you read from has actually been written to yet.
🚀 Step 5: Compile and load the indicator
Press F5 in the NinjaScript Editor. The Errors tab at the bottom should say “Compile succeeded.” If it doesn’t, double-click the red line — it’ll take you to the offending character. The most common causes of a first-time failure are missing semicolons and mismatched braces.
Now open any chart, right-click, Indicators…, and search for MyFirstSMA. Add it, click OK, and you’ll see a line painted across the chart that changes color as the slope changes. Change the Period input and reapply — same indicator, different smoothing.
🗺️ Where to go from here
This indicator uses eight separate concepts that each have their own post in the series. If any part of the walkthrough was fuzzy, the foundational post for that piece is probably the fastest fix:
- Variables & Properties — why
Periodis declared the way it is. - OnStateChange — the lifecycle states you’ll end up handling in every indicator you write.
- OnBarUpdate — the per-bar heartbeat.
- Plots — everything
AddPlotcan do that we didn’t touch here. - Brushes — custom colors, transparency, and why
Brushes.LimeGreenisn’t the only option. - Booleans / If / Conditions — the ternary pattern used in the color logic.
- Loops (For / While / Foreach) — the summing loop.
- How to Debug Your Indicator — what to do when the thing refuses to compile or paints the wrong color.
Next week we’ll pick this apart in a different direction: Calculate Modes — OnEachTick vs OnPriceChange vs OnBarClose. The indicator we just wrote works fine on bar close. But the same code running OnEachTick behaves very differently, and if you’ve ever had an indicator that “works in backtest and breaks live,” that post is where the answer usually lives.