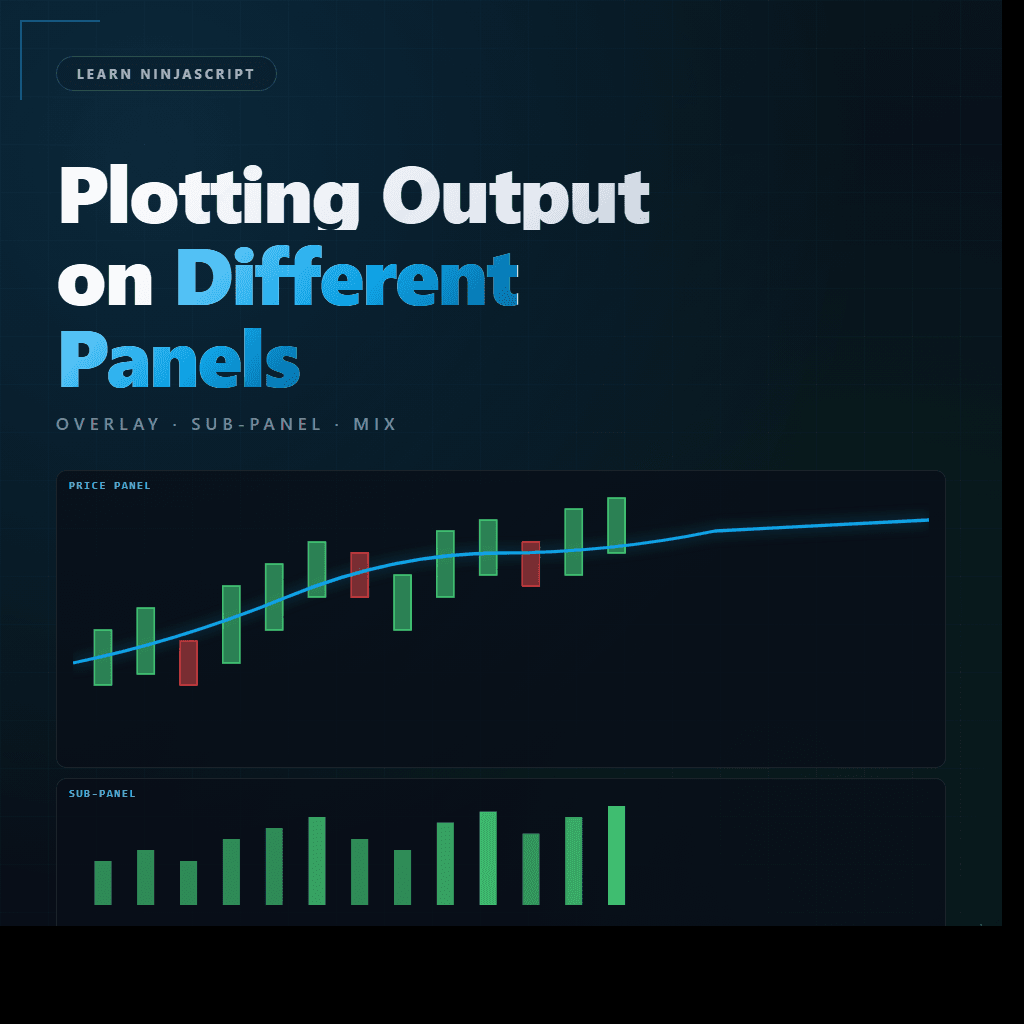
Learn NinjaScript: Plotting Output on Different Panels
Some indicators belong on the price panel — moving averages, VWAP, pivots, trend lines. Some belong in a sub-panel — RSI, MACD, oscillators, anything whose scale is unrelated to price. A few indicators want both: an overlay line on the price panel plus a histogram or secondary metric in a sub-panel below.
NinjaScript’s IsOverlay property sets the default; the AddPlot overloads and Panel property handle the per-plot case. Auto-scaling behavior differs between them in ways that matter.
⚙️ IsOverlay — the Class-Level Default
IsOverlay is a bool set in State.SetDefaults. true means the indicator’s plots appear on the price panel; false means they appear in their own sub-panel below the price panel.
protected override void OnStateChange()
{
    if (State == State.SetDefaults)
    {
        Name      = "My Indicator";
        IsOverlay = true;    // plots on the price panel
        // ... AddPlot, etc.
    }
}
One property, one decision — the whole indicator’s default panel placement. Most indicators need nothing more than this.
🎨 The Panel Property and Per-Plot Routing
When you want most plots on one panel but a specific one on another, IsOverlay alone isn’t enough. The class sets a default; individual plots can override via the Panel property or specific AddPlot overloads.
The cleanest pattern: set IsOverlay for most plots, use a separate sub-panel-based indicator for the one that needs a different scale. Mixing panel routing within a single indicator is supported but tricky with auto-scaling.
🎯 Mixing Panel Plots (When You Really Need It)
A dashboard-style indicator with two plots — SMA on the price panel plus a histogram of slope in a sub-panel — needs per-plot panel control. The approach uses a sub-panel IsOverlay = false indicator and then explicitly bumps specific plots to the price panel via an AddPlot overload that takes a Panel argument:
protected override void OnStateChange()
{
    if (State == State.SetDefaults)
    {
        IsOverlay = false;    // default: sub-panel
        AddPlot(Brushes.LimeGreen, "Slope");   // goes on sub-panel (default)

        // Overlay plot on the price panel:
        AddPlot(new Stroke(Brushes.Orange, 2), PlotStyle.Line, "SMA");
        Plots[1].Panel = 1;   // 1 = price panel; 2+ = sub-panels
    }
}
Readable for two plots. For more, consider splitting into two indicators — it’s cleaner than managing panel assignments manually and keeps each indicator single-purpose.
📏 Auto-Scaling Behavior
The price panel auto-scales to fit the visible bars’ price range. A plot whose values fall outside that range — a histogram of values 0 to 100 on a chart showing ES at 5400 — either gets clipped or distorts the price scale beyond usability.
Sub-panels have their own y-axis computed from their own plots’ values. That’s exactly what you want for RSI or any oscillator that lives in its own scale. If your indicator’s values are unrelated to price, sub-panel is the right choice every time.
BarsRequiredToPlot on the plot is a different knob — it controls how many bars must exist before a plot value renders, independent of panel choice. Useful when the first bars of a plot would be zero or meaningless and you don’t want them squashing the auto-scaled range.
🛠️ The Anchor Example — MySma With a Slope Histogram
A variant of MySma that plots the SMA as an overlay and the per-bar slope as a sub-panel histogram. Two plots, two panels, one indicator file.
protected override void OnStateChange()
{
    if (State == State.SetDefaults)
    {
        Name       = "My SMA + Slope";
        Calculate  = Calculate.OnBarClose;
        IsOverlay  = false;    // default to sub-panel
        Period     = 20;

        // Plot 0: slope histogram in the sub-panel.
        AddPlot(new Stroke(Brushes.LimeGreen, 2), PlotStyle.Bar, "Slope");

        // Plot 1: SMA line on the price panel.
        AddPlot(new Stroke(Brushes.Orange, 2), PlotStyle.Line, "SMA");
        Plots[1].Panel = 1;
    }
}

protected override void OnBarUpdate()
{
    if (CurrentBar < Period + 1) return;

    double sma  = SMA(Period)[0];
    double prev = SMA(Period)[1];

    Values[1][0] = sma;                    // overlay plot
    Values[0][0] = sma - prev;             // slope histogram in sub-panel
}
Result: SMA line overlaid on price, slope histogram below. Same file, two panels, no scale-collision issues because each plot lives on its own panel’s auto-scaled y-axis.
📝 Pitfalls Checklist
- Overlay plot with a value range far from price. A histogram of 0-100 on the price panel squashes the price range into a sliver. The plot technically works; the chart becomes unreadable.
- Setting
IsOverlayoutsideState.SetDefaults. Too late — the panel is already decided. Always set it inSetDefaults. - Forgetting that
BarsRequiredToPlothides the plot during warmup. You think the indicator is broken; it’s just waiting for the required bar count. Default isPeriod; set to 0 if you want plots to render immediately. - Mixing panels without understanding the Panel numbering. Panel 1 is the price panel, Panel 2+ are sub-panels in order of addition. Sub-panel numbering can shift if another indicator adds a sub-panel above yours.
- Splitting when you should merge, or merging when you should split. A dashboard with three related values wants one indicator with multiple plots in a sub-panel. Three unrelated metrics on three panels wants three indicators.