Cascade Renko: A NinjaTrader 8 Bar Type Whose Bricks Grow as a Run Extends
A free NinjaTrader 8 Renko bar type whose bricks get wider the further a run extends — so a long trend stops flooding the chart, and every new brick costs more than the one before it. Here’s the idea, what it does on a chart, what it costs you, and the download.
A few weeks ago I posted Acceleration Renko — a Renko whose bricks get narrower as a run continues, so momentum shows up as bar density. Cascade is the same mechanism with one sign flipped.
That sounds like a footnote. It isn’t. The two behave nothing alike on a chart, and the reason they diverge is the interesting part.
🧱 The same seam, the other way
Almost every Renko variant settles the brick width before the brick is drawn. Either it’s a number you typed into a settings box, or it’s measured from the market — volatility over the last N ticks, the average range of recent sessions. Both are ambient readings. Neither knows how far the current run has already travelled.
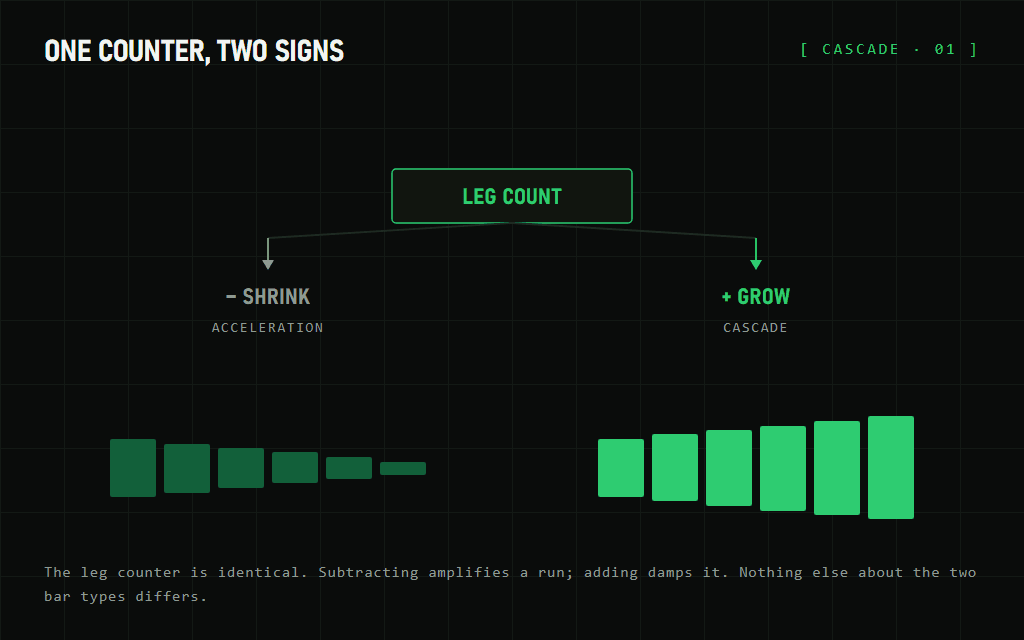
Both of these bar types change the same thing: they feed the leg count — how many consecutive same-direction bricks have printed since the last reversal — back into the threshold for the next one. The brick is sized from the bar type’s own output rather than from the market around it.
From there it’s one operator:
growth = 1 + (legCount * step)
brick  = baseBrick * growth
Subtract and the bricks shrink, which amplifies a run. Add and they grow, which damps one. The full walk through the feedback idea is in the Acceleration post; this one is about what happens when you push the other way.
🌊 What a long run does to a Renko chart
Here’s the thing Cascade is actually built for.
Put a standard Renko on a market that trends hard for an hour and you get a wall of identical bricks. Forty, fifty, sixty of them, each exactly the same size, marching across the screen. It’s accurate. It’s also close to unreadable, and it squashes everything that happened before the run into a stub at the left edge.
That’s not a complaint about rendering. It’s an information problem. Fifty identical bricks tell you the same fact fifty times, and the chart spends most of its width saying it.
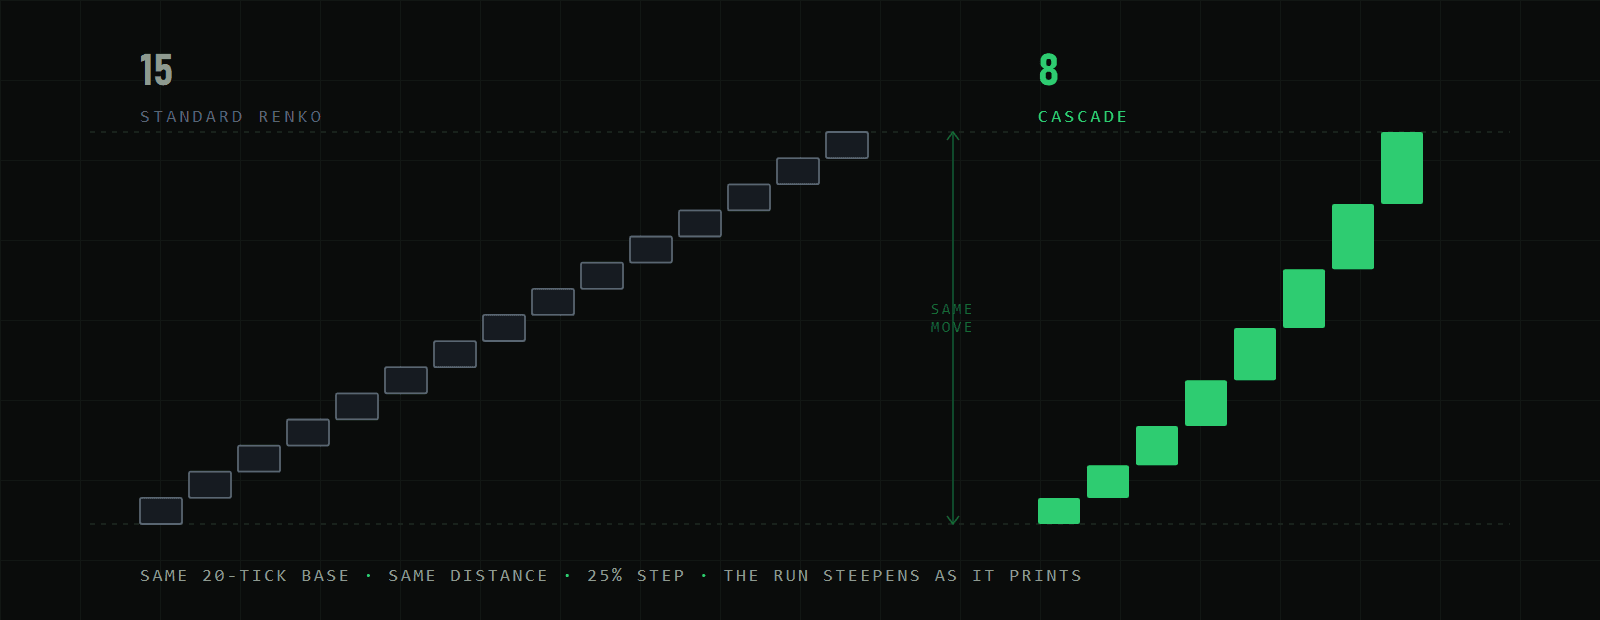
Volatility-scaled Renkos help with this across sessions — they’ll draw wider bricks on a fast day than a slow one. What they don’t do is respond within the move. Brick forty of a run gets the same treatment as brick one, because the volatility reading is the same at that moment either way.
🐢 Cascade Renko
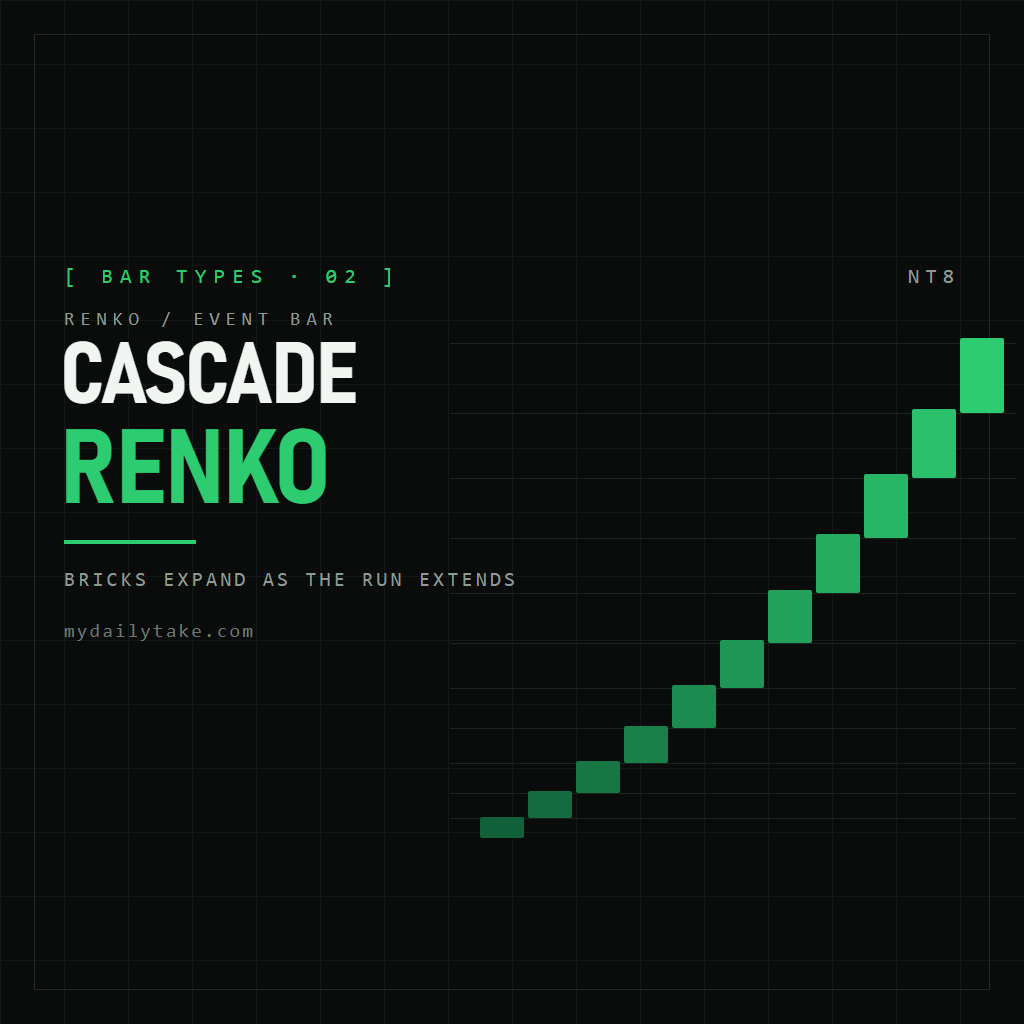
Each consecutive brick in the same direction raises the bar for the next one. At a 20-tick base and a 25% step — the settings on the charts below — a run prints:
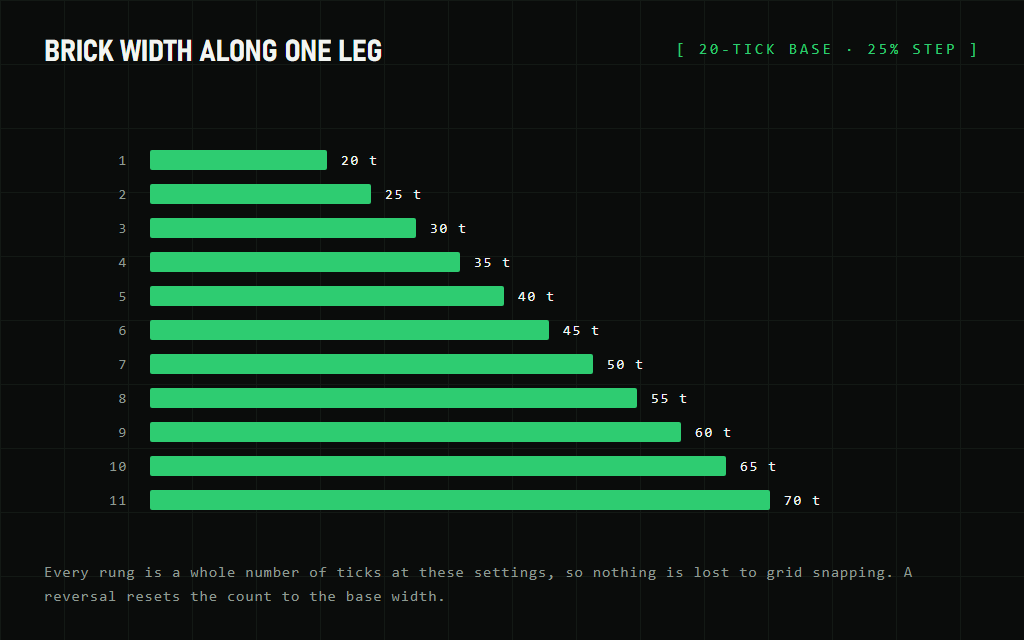
A trend that keeps going has to work progressively harder to print anything. The run stretches out across the chart instead of flooding it, and the bricks that do print stay legible.
A reversal resets the count, and the next leg starts back at the base width.
🔁 Why it settles instead of running away
Read the loop and you’ll notice it works against itself.
A wider brick puts the next threshold further away. A further threshold takes longer to reach. Taking longer means the leg count advances more slowly, which means the brick grows more slowly.
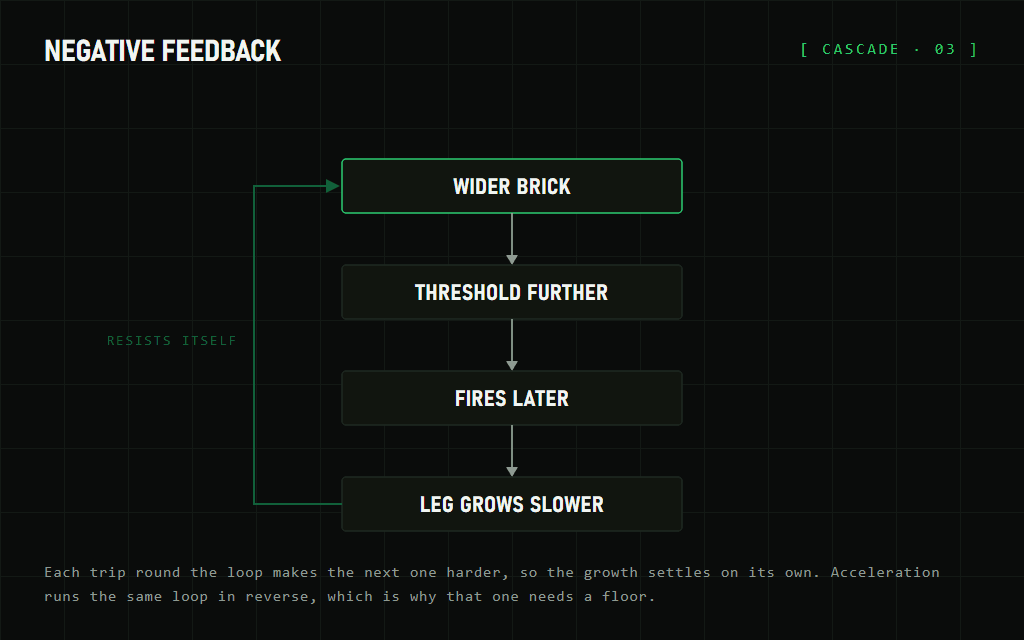
Acceleration’s loop does the opposite — smaller brick, closer threshold, fires sooner, smaller again — which is why it needs a floor to stop it collapsing toward a zero-width brick that every tick would satisfy.
Cascade needs no ceiling for the same reason in reverse. It is self-limiting by construction. Nothing has to clamp it, because the mechanism already resists.
📈 A late brick means more than an early one
This is the part I didn’t expect when I built it.
On a standard Renko every brick is worth exactly the same. Brick one and brick thirty of a run represent identical price movement, so counting bricks tells you how long a move has gone on but nothing about how hard it’s working.
On Cascade they aren’t equal. At 20 and 25%, brick 1 is 20 ticks and brick 11 is 70. A brick printing deep into a run represents three and a half times the movement of the one that started it.
So the bar type carries trend maturity in its own geometry. You don’t need a separate indicator to tell you a move is extended — the width of the brick you’re looking at already says so, and it says it in ticks rather than as a normalised oscillator reading you have to interpret.
🧮 I capped it, then took the cap back out
Unbounded growth sounded like something that ought to be bounded, so the first build had a maximum multiplier on it. Then I did the arithmetic and removed it.
Reaching leg n costs the sum of every brick before it. At base b and step s, that’s b × (n + s·n(n−1)/2). At a 20-tick base with a 25% step, a brick six times the base means leg 20 — and getting there takes 1,350 ticks in one direction with no reversal along the way. On NQ that is 337 points in a single unbroken leg.
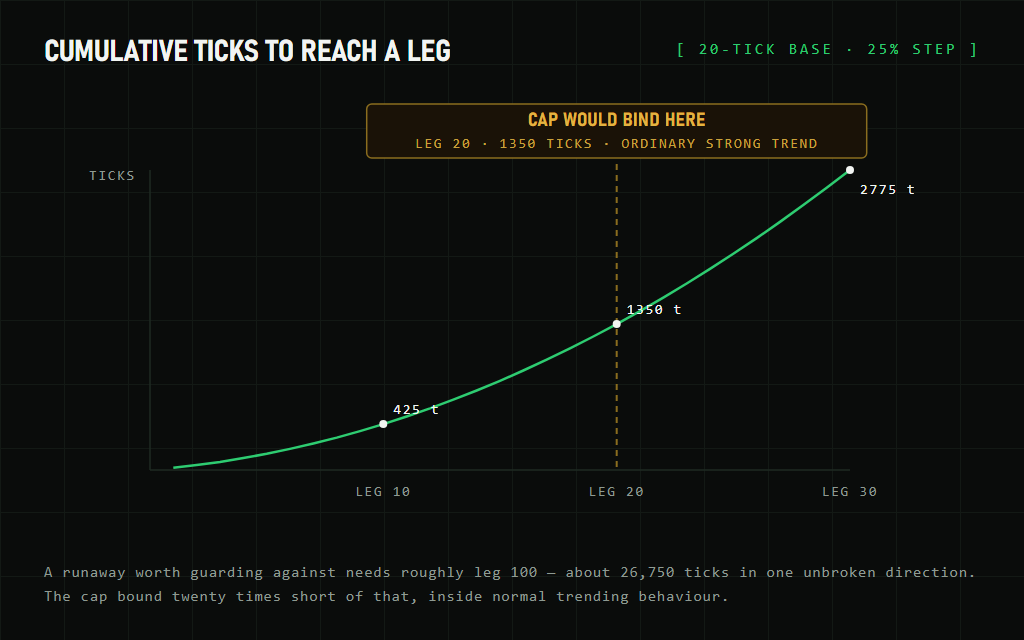
The cap I’d written would have bound around leg 20. That’s not an edge case — that’s an ordinary strong trend. It would have clipped exactly the progressive damping the bar type exists to provide, in exchange for protection against a runaway that needs a leg roughly twenty times longer than that — about 26,700 ticks, which is not a move I could find to test it on.
And the growth is self-limiting anyway, for the reason in the section above. So it came out. It’s uncapped deliberately, and the arithmetic above is the reason.
⚖️ Reversals get expensive at extension
Here’s what it costs you, and it’s the exact mirror of Acceleration’s problem.
A Renko reversal takes twice the current brick. On Cascade the current brick has been growing all the way up the leg, so the reversal grows with it:
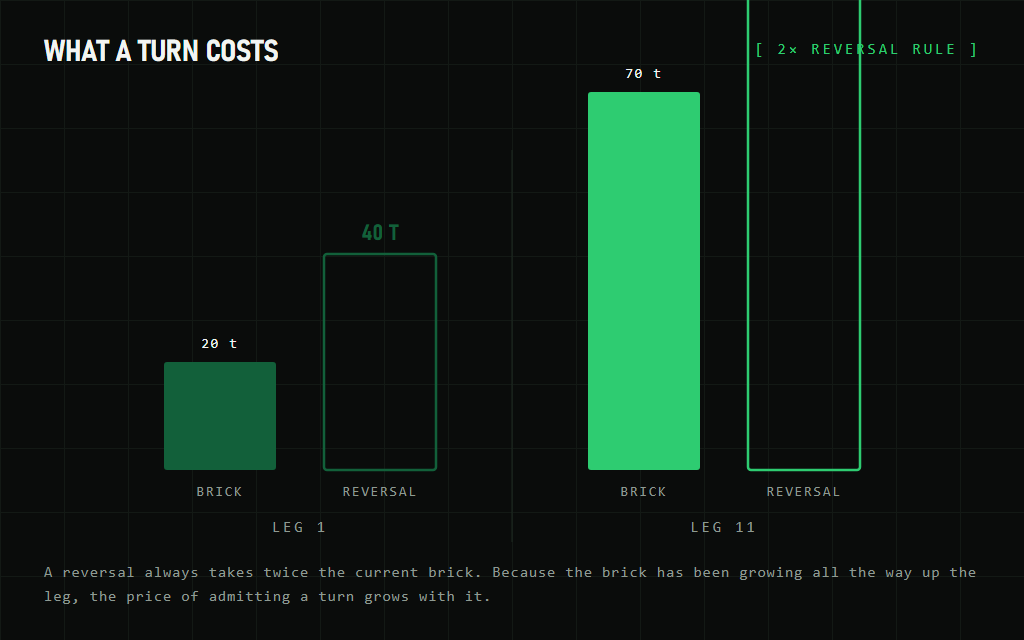
You will be late on the turn. A trend that has run a long way needs a substantial move against it before Cascade prints anything in the other direction.
You can read that two ways and both are fair. It ignores the noise that shakes people out of good trends, which is the point. It also hands back a real piece of a reversal before it acknowledges one, which is the cost. Which of those you get depends on your base size and step — and if you’re trading turns rather than trends, this is probably the wrong bar type for you.
📊 On the chart
All of these are NQ at a 20-tick base and a 25% step.
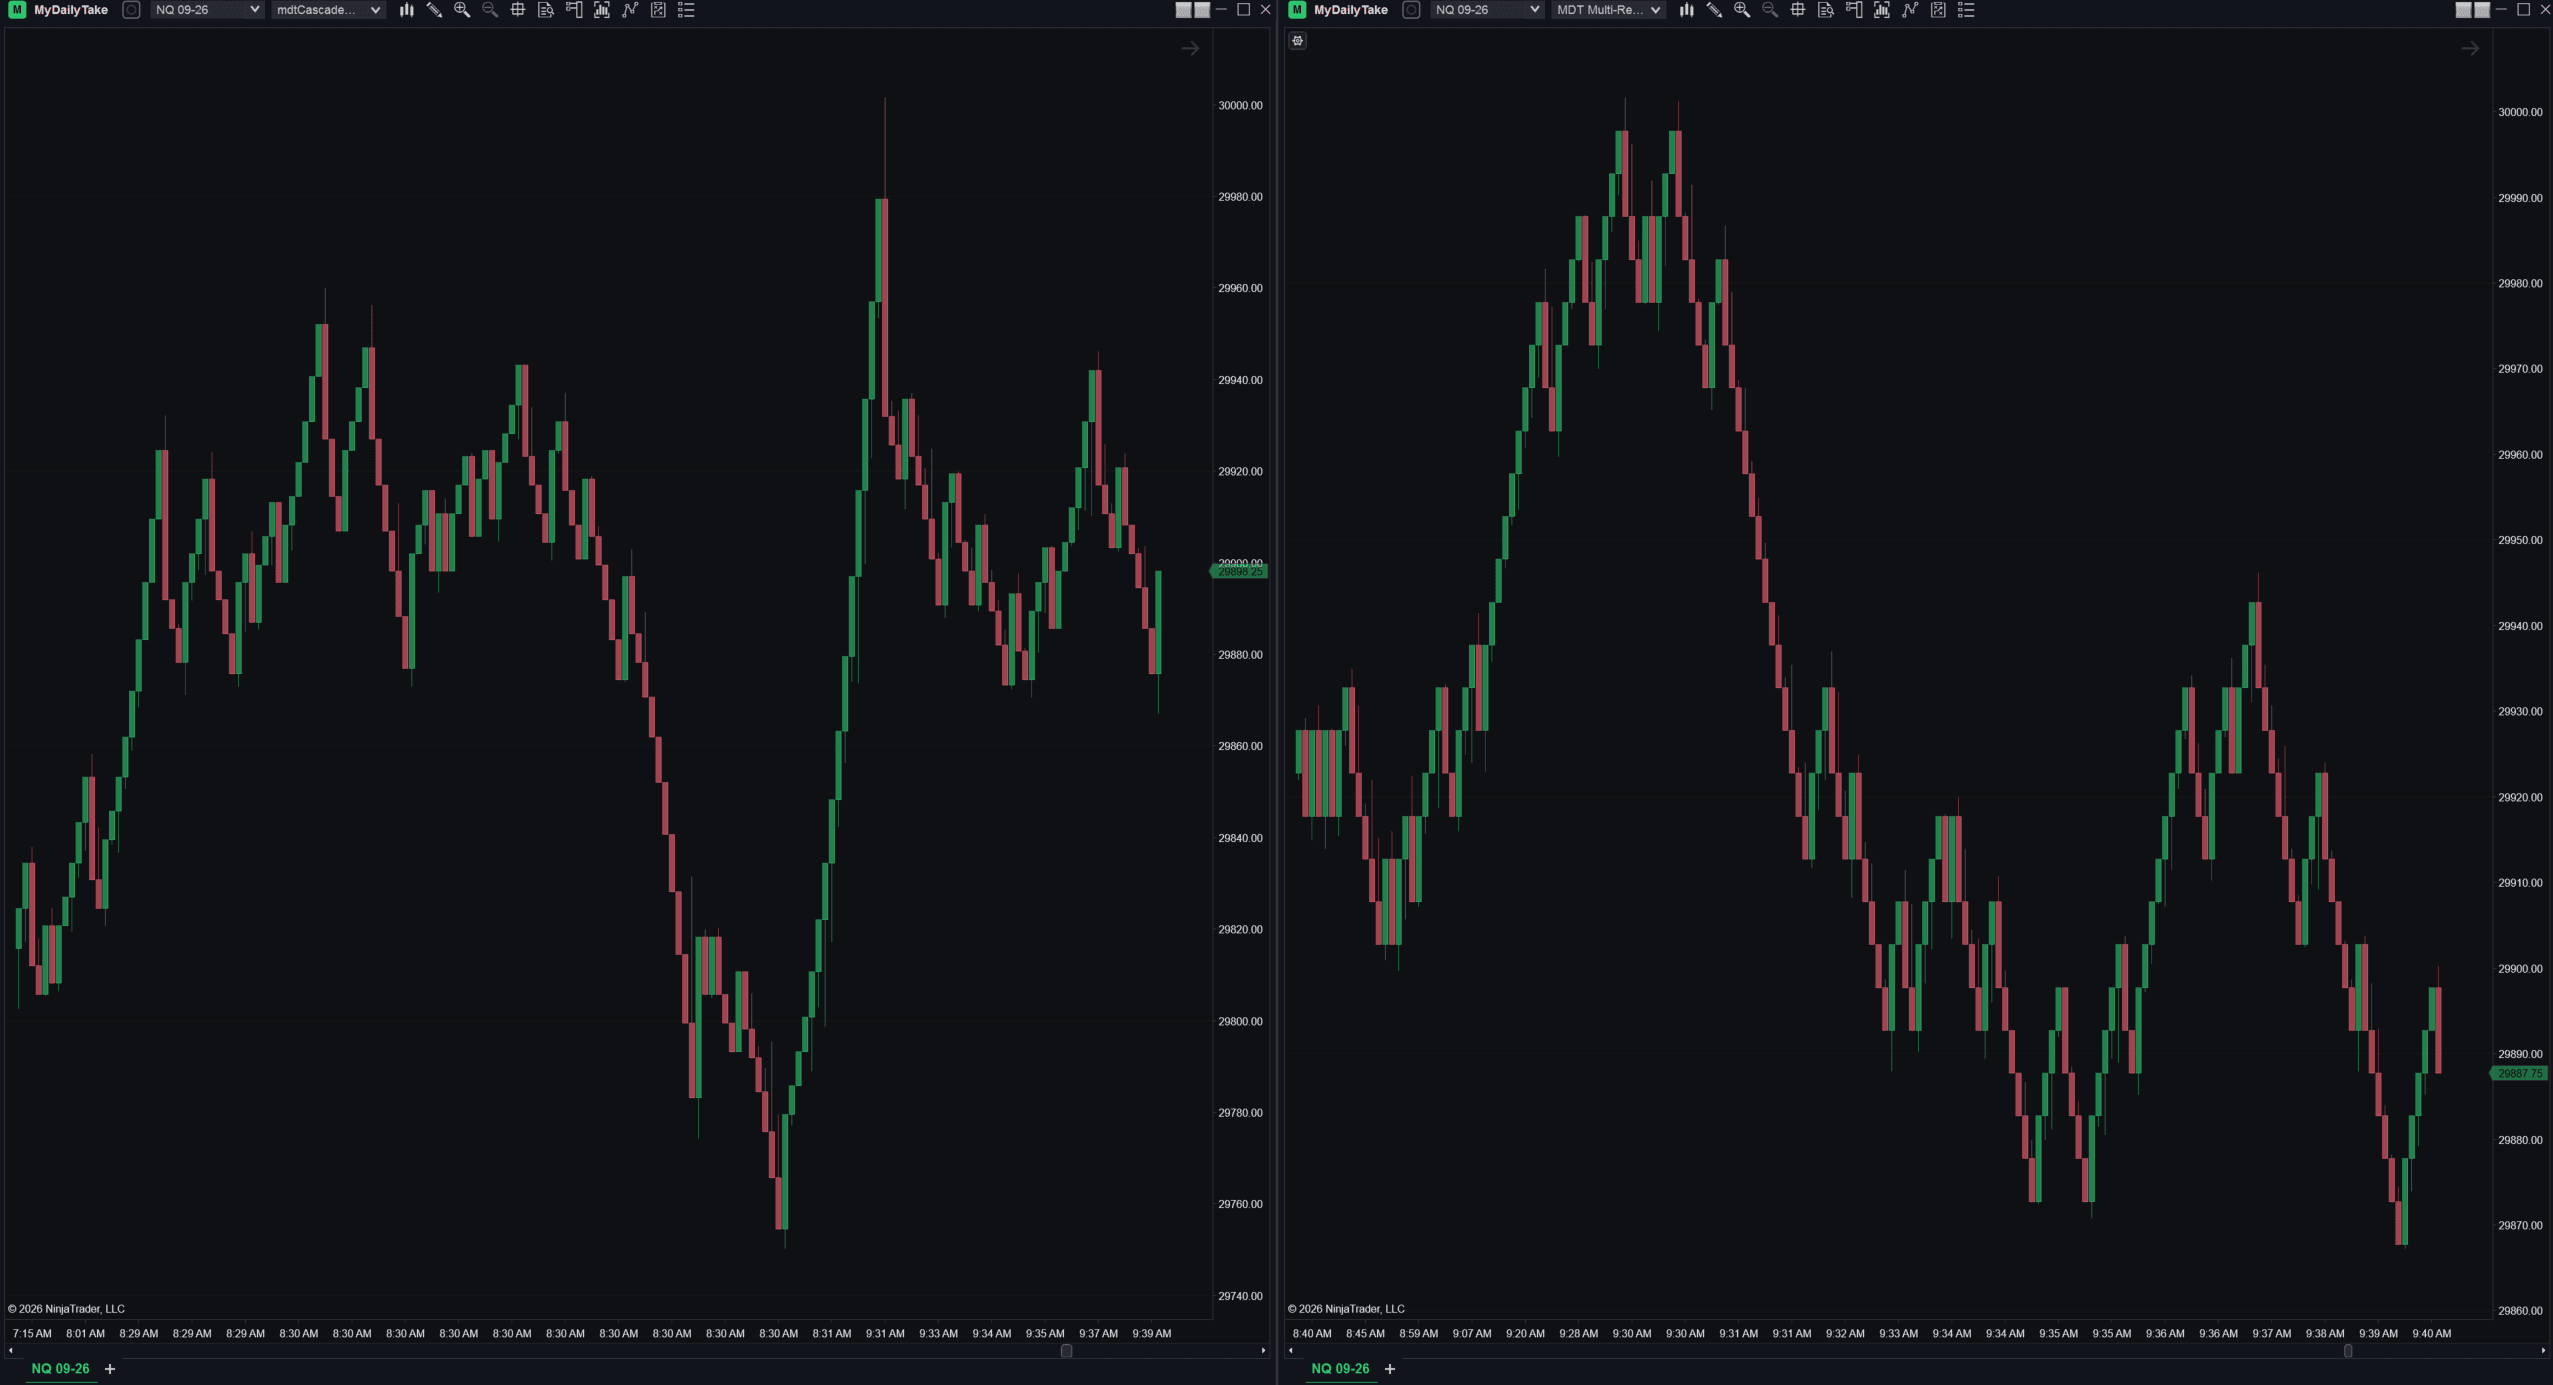
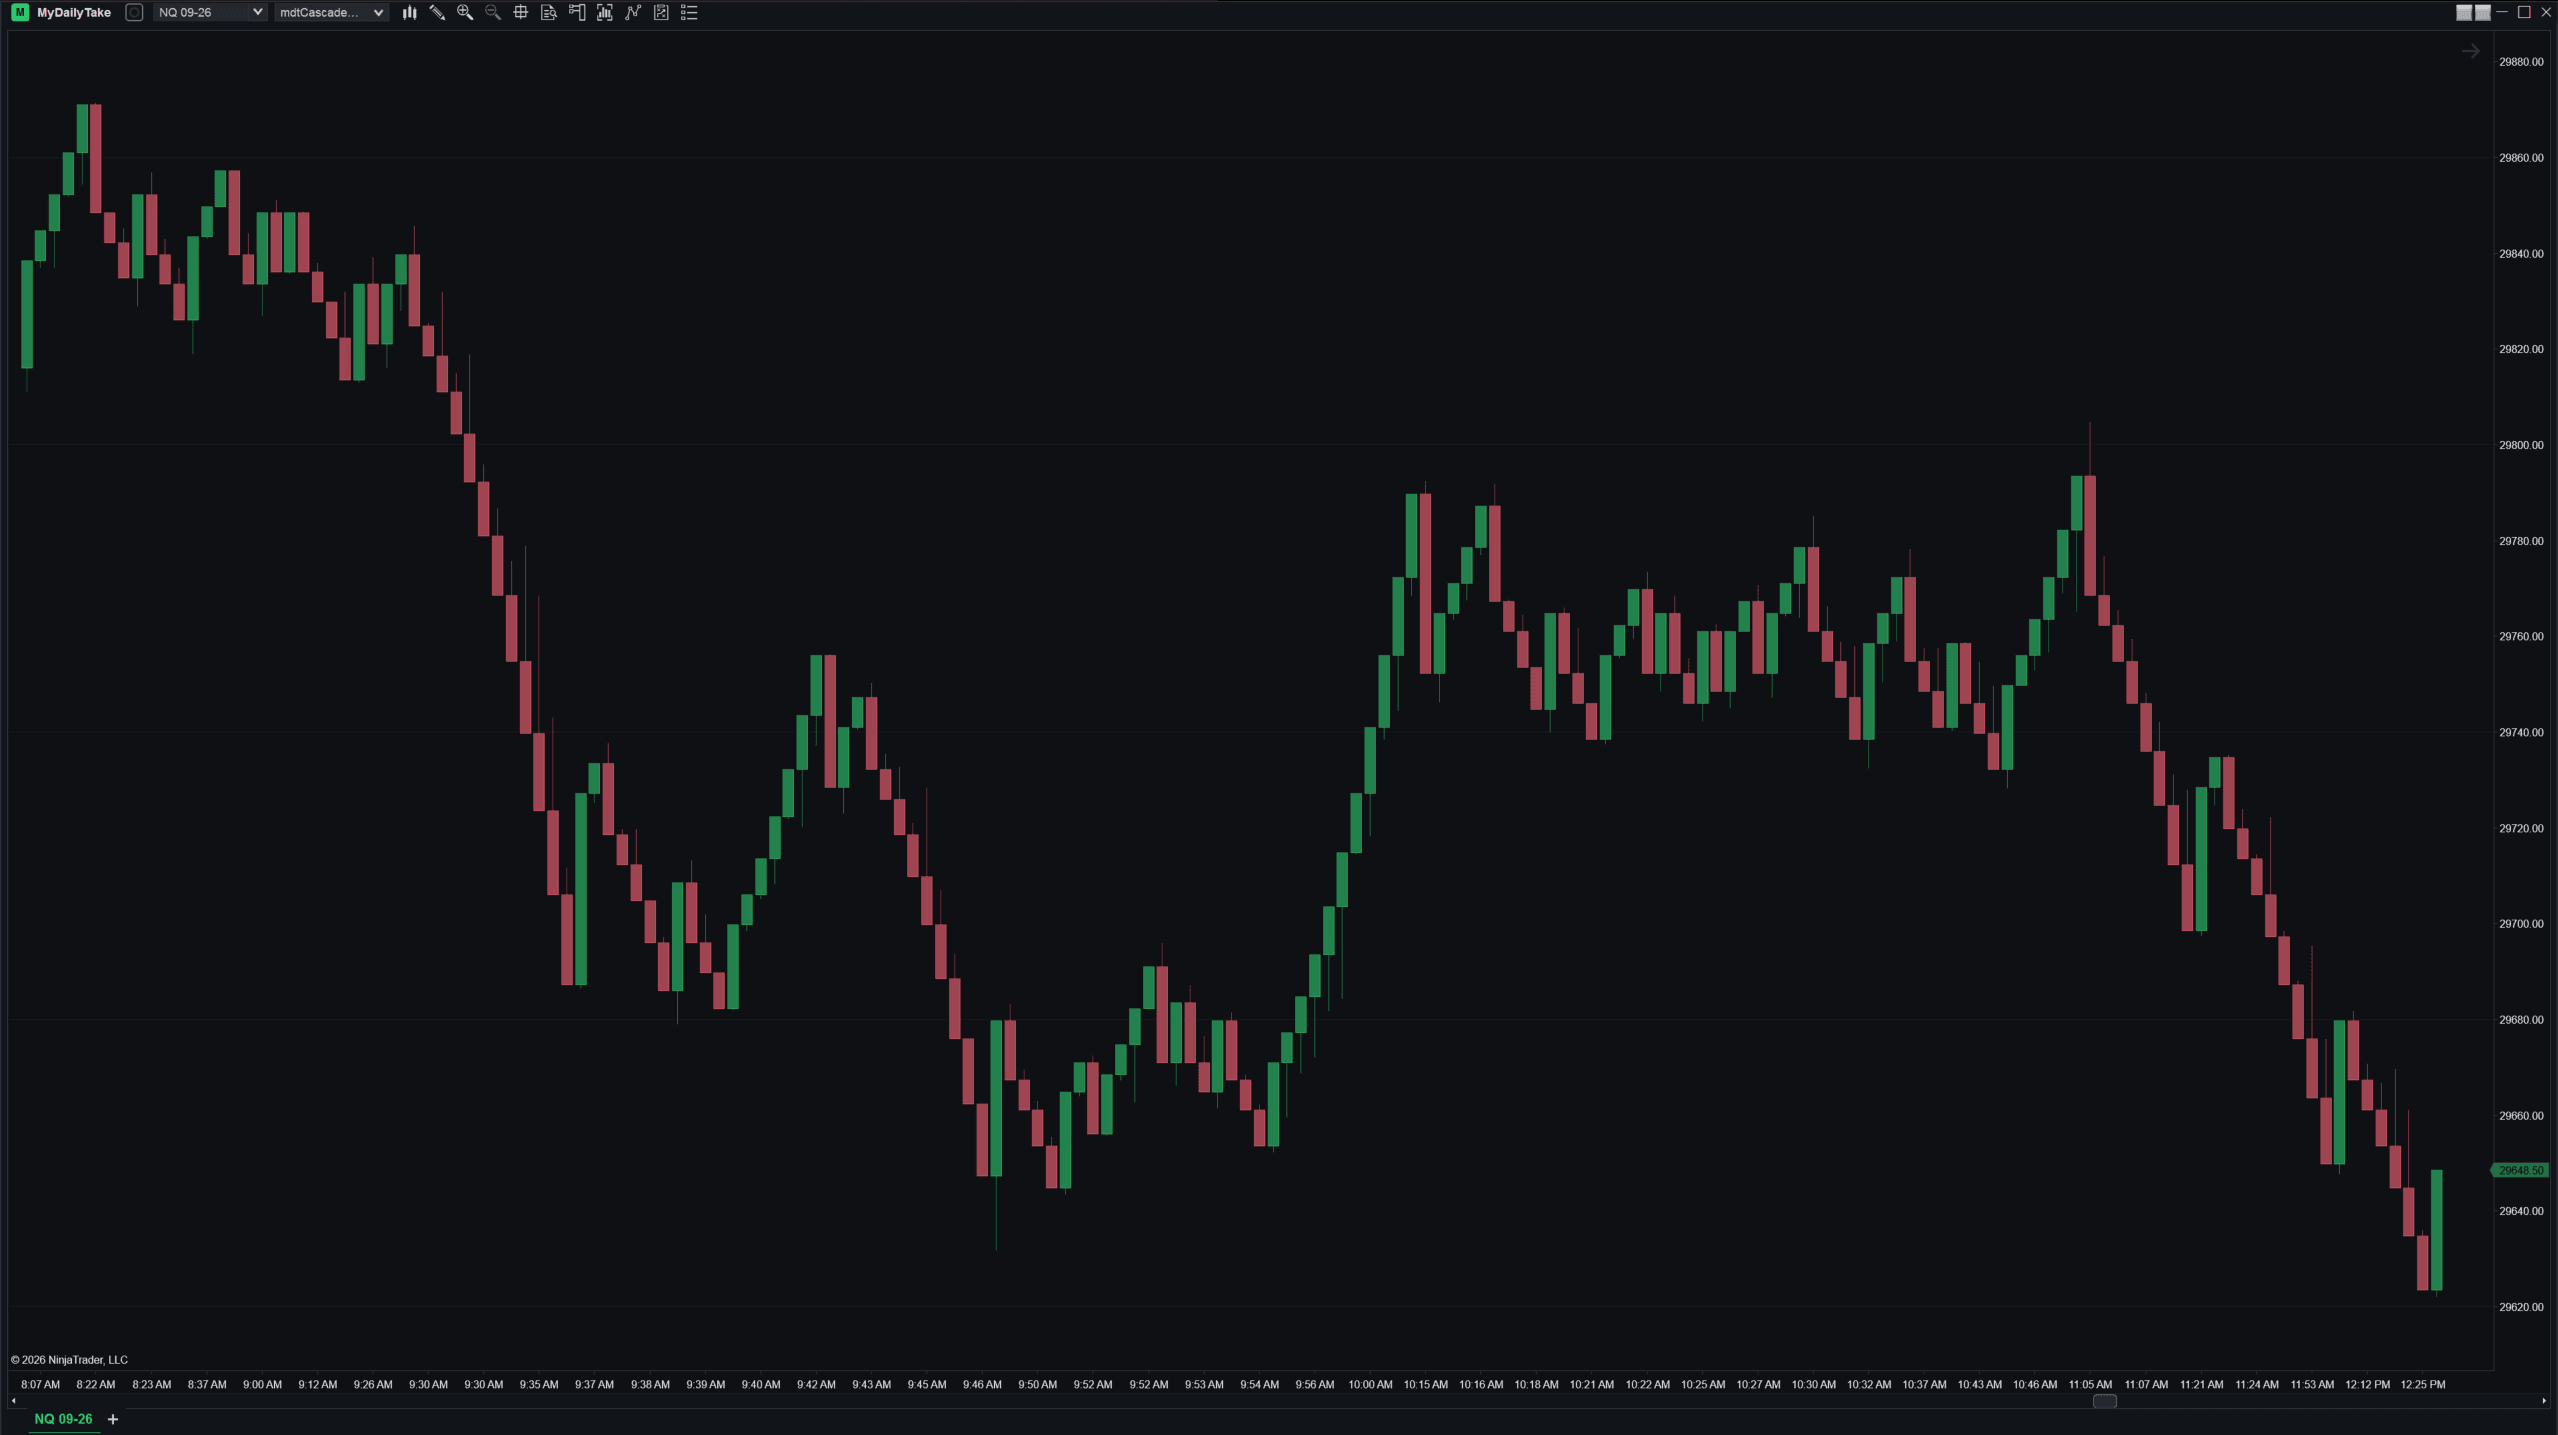
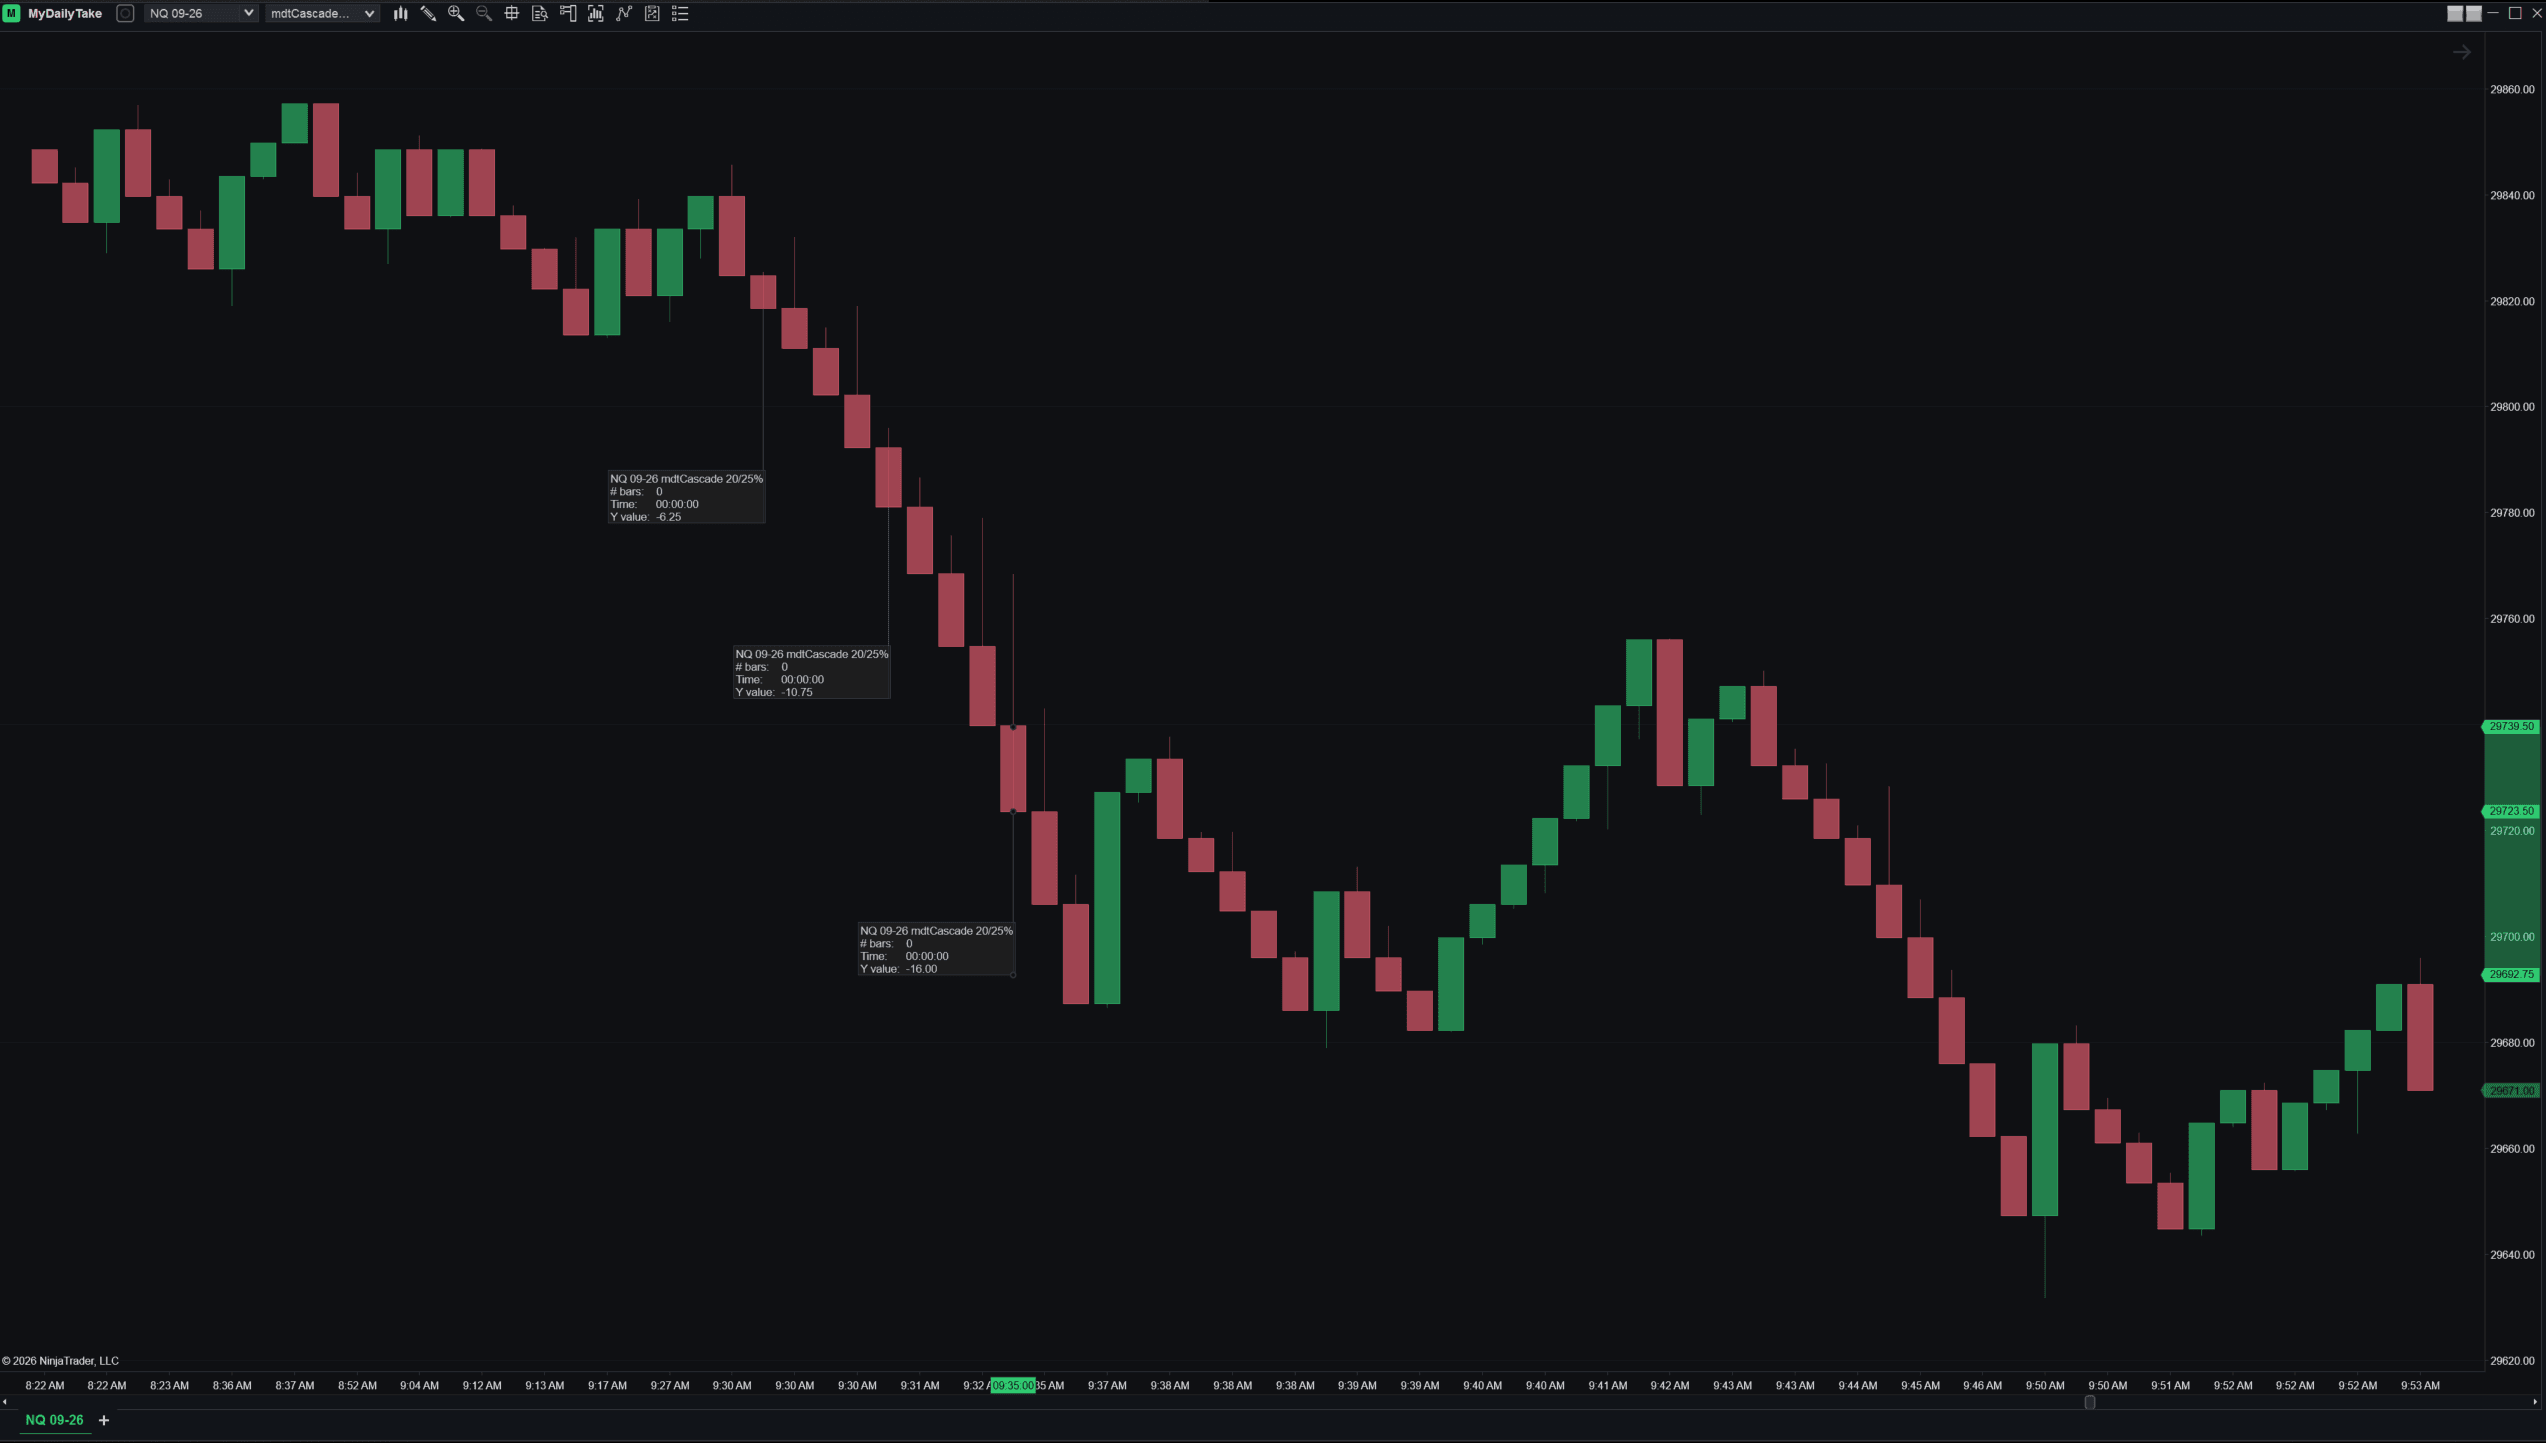
That’s the behaviour the whole thing is for, and you can measure it rather than take my word for it. Three ruler drags down one leg of that descent read 6.25, 10.75 and 16.00 points — 25, 43 and 64 ticks, against a designed ladder of 20, 25, 30, 35, 40, 45, 50, 55, 60, 65.
The first is exact. The other two sit a tick or two off, which is roughly what a hand-dragged ruler gives you on a chart where one tick is a couple of pixels. The direction is the part that matters: the bricks got wider the further the leg ran.
mdtCascade 20/25%.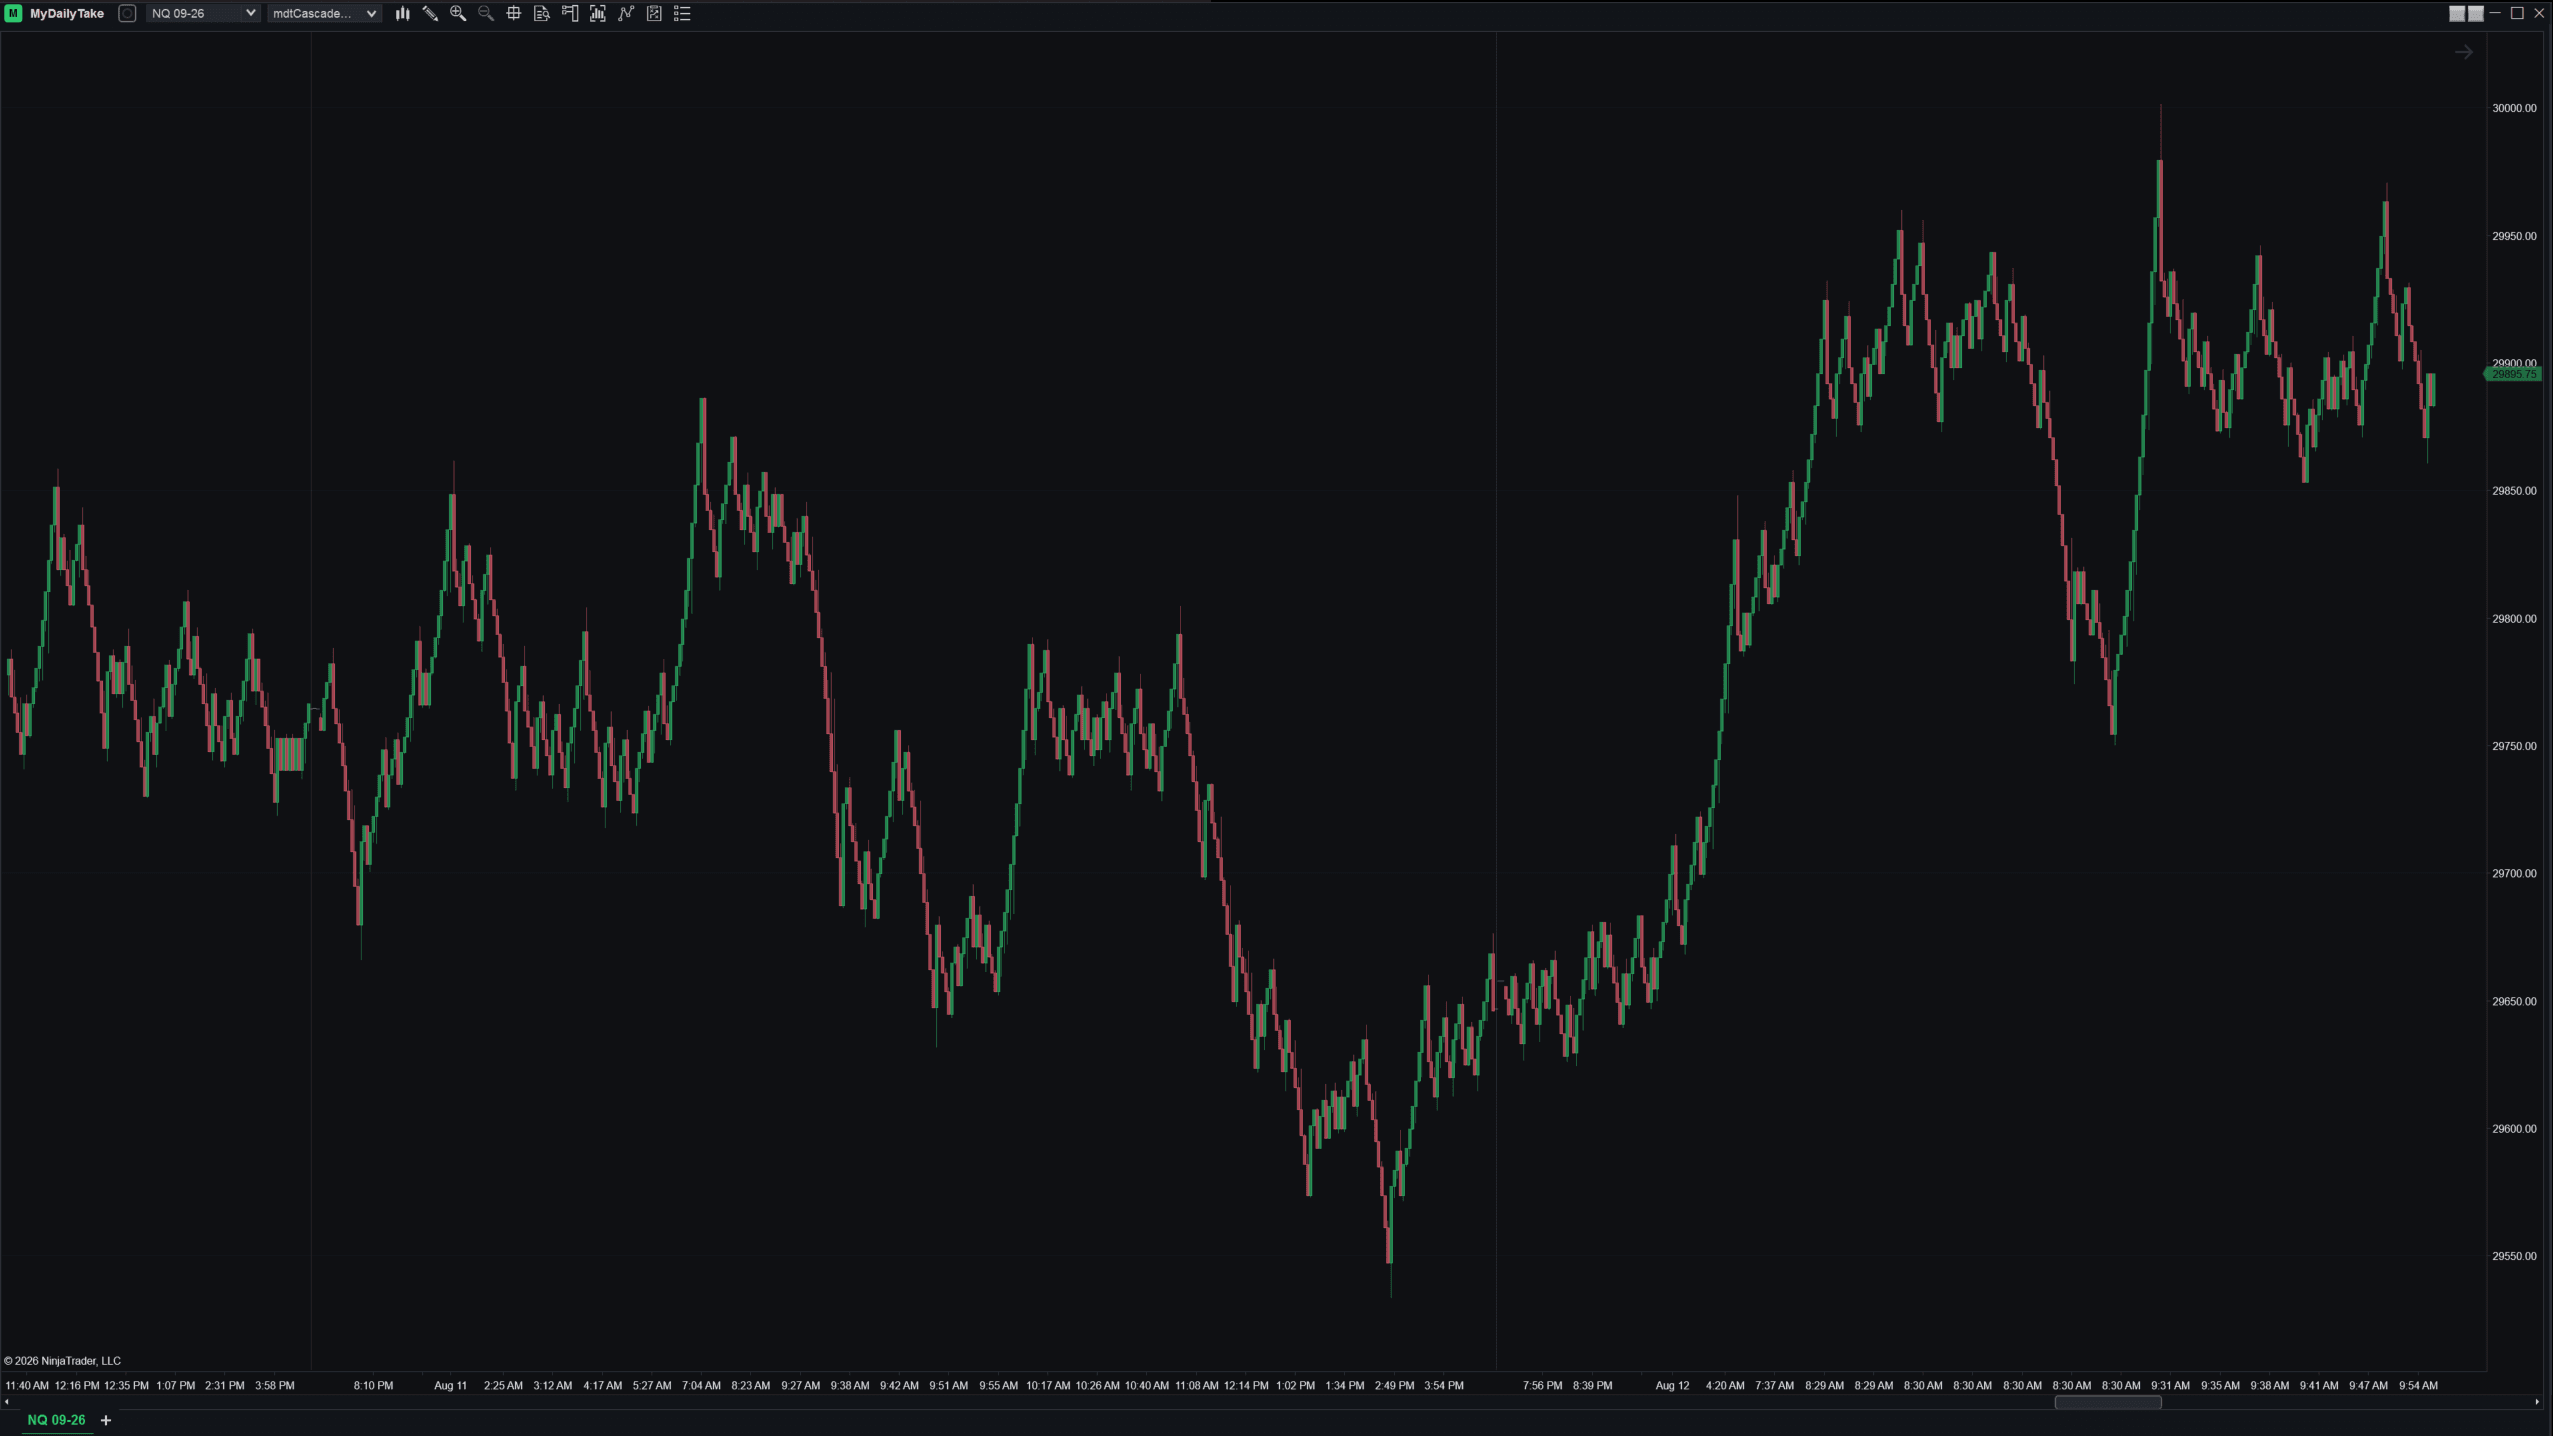
⚙️ Settings
Two settings, both on the Data Series dialog where you pick the bar type. The base is the only one you need to size to your instrument.
| Setting | What it does |
|---|---|
| Base brick (ticks) | Width of the first brick in a run. Everything scales from this. Size it to the instrument — 20 ticks suits NQ, and the bar type ships defaulted to 8. A slower market wants more. |
| Cascade step % | How much wider each successive brick gets. Clamped to 0–200. Set it to 0 and you get a canonical Renko back, which is a useful way to see exactly what the feature is doing. |
Widths snap to whole ticks, so every brick sits on the instrument’s price grid. That puts a floor under how small the base can usefully be: a 25% step on a 2-tick brick rounds straight back to 2, so the cascade would only move in lumps. Pick a base wide enough that one step shifts at least a whole tick. At the 20 used here every rung is exact — 20, 25, 30, 35, 40.
🛠️ Using it from a strategy
You can add Cascade as a secondary series and read its bricks from a strategy or an indicator. Brick height is the useful part — it tells you how far into a leg you are without tracking the count yourself.
private const int CascadeBarsType = 7128;   // mdtCascadeRenko

protected override void OnStateChange()
{
    if (State == State.SetDefaults)
    {
        Name      = "CascadeRenkoExample";
        Calculate = Calculate.OnBarClose;
    }
    else if (State == State.Configure)
    {
        // Base brick in ticks, cascade step in percent — the same two numbers
        // you would set in the bar-type dialog. Set BOTH: AddDataSeries never
        // applies a bar type's own defaults, so anything you leave out stays 1.
        AddDataSeries(new BarsPeriod
        {
            BarsPeriodType = (BarsPeriodType) CascadeBarsType,
            Value          = 8,
            Value2         = 25
        });
    }
}

protected override void OnBarUpdate()
{
    // BarsInProgress 1 is the Cascade Renko series added above.
    if (BarsInProgress != 1) return;
    if (CurrentBars[1] < 2) return;

    // Brick direction. Renko bricks close at their extreme, so comparing the
    // close to the open is enough to know which way this brick printed.
    bool brickUp = Closes[1][0] > Opens[1][0];

    // Brick height in ticks. This GROWS as a leg extends, so it doubles as a
    // read on how mature the current move already is — no counter needed.
    double brickTicks = Math.Abs(Closes[1][0] - Opens[1][0]) / TickSize;

    Print(Times[1][0] + "  " + (brickUp ? "up" : "down")
        + "  " + brickTicks.ToString("0") + " ticks");
}
One trap worth knowing: new BarsPeriod leaves any integer you don’t set at 1, and AddDataSeries never applies a bar type’s own defaults. Set both Value and Value2 or you’ll silently get a 1% step instead of the one you meant.
📝 One honest note
A bar type is not an edge. Cascade makes a long trend readable and puts its maturity into the width of the brick you’re looking at. It will not tell you whether that trend is worth trading.
The usual Renko trade still applies too: time disappears from the chart, and small counter-moves get compressed out. That’s what you accepted by using Renko at all, and this doesn’t change it in either direction.
And one specific to this one — because reversals get more expensive the longer a leg runs, Cascade is a poor fit if your method depends on catching turns early. It was built for the opposite job.
📦 Download
Free, and there’s no licence key, activation or sign-in — import it and it works.
Install:
- Download both files — the bar type, and MdtBarsCommon, the shared library it’s built on.
- In NinjaTrader 8, go to Tools → Import → NinjaScript Add-On and import each one.
- Restart NinjaTrader once, after both imports — import one, restart, and the bar type won’t appear.
- Open a chart, choose mdtCascade from the bar type dropdown, and set your base brick and cascade step.


This is the second post in a series on bar types. The first went the other way with the same mechanism. There are more in the folder — some worked, some didn’t, and the ones that didn’t are usually more interesting to explain.