
TradingView Smart Money Volume Index [AlgoAlpha] Conversion to NinjaTrader 8
Norman Fosback’s Positive Volume Index (PVI) and Negative Volume Index (NVI) are old-school: PVI accumulates only on rising-volume bars (the crowd, the dumb money), NVI only on falling-volume bars (the operators, the smart money). The classic read is that NVI rising while PVI is flat = quiet accumulation. AlgoAlpha’s Smart Money Volume Index takes that primitive and forges it into a modern oscillator.
The two indices are detrended against a 255-EMA, run through RSI to bound them in [0..100], combined into Buy / Sell ratios, summed over a window, and finally normalized to a peak — producing IndexBuy / IndexSell in [0..1] and a NetIndex in [-1..1]. Two display modes (Compare and Net), a high-interest zone-fill above the threshold and below its negative, and price-panel candle recoloring tied to the active state.
This post is the NinjaTrader 8 conversion. The full source compiles standalone in indTradingView/, exposes IndexBuy, IndexSell, and NetIndex as Series<double> outputs for strategy use, and is yours to download as a NinjaScript Archive.
Original Pine Script: Smart Money Volume Index by AlgoAlpha
License: Mozilla Public License 2.0 (MPL 2.0)
🆚 What Makes Smart Money Volume Index Different
Standard volume indicators look at total volume — they tell you how much trading happened, not who was doing it. PVI/NVI’s value is in the split: rising volume = participation surge (likely retail), falling volume = quiet accumulation (likely institutional). AlgoAlpha’s contribution is taking that raw split and turning it into a usable oscillator with a clear high-interest threshold.
Two display modes. Compare plots Buy and Sell interest as separate lines, each filled toward zero, so you can see when one side is committing and the other is dormant. Net combines them into a single oscillator centered on zero, filled bull/bear above and below — easier read at a glance.
High-interest zone fills. A pair of SharpDX gradient bands lights up the panel area above the threshold (default 0.9) and below its negative. The bands brighten when interest is currently in that zone and dim when it isn’t, so a peripheral glance at the panel tells you ‘we’re in a high-conviction state’ without parsing line crossings.
Price-panel bar coloring. Candles on the price panel recolor in the active interest direction when interest is above threshold. This is BarBrushes from a sub-panel indicator — it makes the chart itself show the regime without adding overlays.
⚙️ Settings
Smart Money Volume Index exposes its inputs in two property groups: the calculation parameters that drive PVI/NVI, RSI routing, summation window, and normalization peak, plus the color group with the four trend-tone brushes used by the lines, fills, and bar coloring.
Settings
| Parameter | Default | Description |
|---|---|---|
| Display Mode | Net | Compare = Buy and Sell interest as separate oscillators. Net = single combined oscillator centered on zero. |
| Index Period | 25 | Bars summed when forming the interest index from the routed RSI ratios. |
| Volume Flow Period | 14 | RSI period applied to the detrended PVI / NVI flows. |
| Normalization Period | 500 | Lookback for the peak used to normalize the index into [0..1]. |
| High Interest Threshold | 0.9 | Level (0.01–0.99) at which interest is considered 'high' for zone fills and bar coloring. |
Colors
| Parameter | Default | Description |
|---|---|---|
| Up Color | #00FFBB | Primary bullish color — Buy Interest line, Net positive fill, bar coloring. |
| Secondary Up Color | #008461 | Secondary bullish accent used in the Net-mode gradient column. |
| Down Color | #FF1100 | Primary bearish color — Sell Interest line, Net negative fill, bar coloring. |
| Secondary Down Color | #840900 | Secondary bearish accent used in the Net-mode gradient column. |
🧠 How It Works
Each bar runs the PVI/NVI accumulation, the detrend + RSI route, the ratio composition, the SUM window, and the normalization to a recent peak.
- PVI / NVI accumulation. Seed both at 1.0. On bars where volume rose, PVI multiplies by Close[0] / Close[1]; on bars where volume fell, NVI does. Otherwise the indices hold. The result is two compounded series that respond to opposite halves of the volume distribution.
- Detrend. Subtract a 255-EMA from each — PVI − EMA(PVI, 255) and NVI − EMA(NVI, 255). The output is centered around zero and ready for an oscillator transformation.
- RSI routing. Run a Volume Flow Period RSI over each detrended series. RSI(detrendedPVI) is the ‘dumb’ flow; RSI(detrendedNVI) is the ‘smart’ flow. Both are bounded in [0..100].
- Ratio composition. rBuy = smart / dumb, rSell = (100 − smart) / (100 − dumb). The interpretation: rBuy goes up when smart-money RSI is rising while dumb is flat (quiet accumulation); rSell goes up in the symmetric distribution case.
- SUM and normalize. Sum each ratio over Index Period bars. Track the rolling peak of the larger of the two sums over Normalization Period. Divide each sum by the peak to land in [0..1]. NetIndex is IndexBuy − IndexSell.
- Plot routing per mode. In Compare mode, IndexBuy and −IndexSell go to plots 0 and 1 (mirrored osc). In Net mode, NetIndex goes to plot 2 if positive or plot 3 if negative — the inactive plot Reset()s for a cleanly broken bull/bear fill.
- Visual states. SharpDX gradient zone fills brighten when interest is above the high-interest threshold; per-bar candles on the price panel recolor in the trend tone when the same condition holds.
The indicator is non-repainting — RSI warmup is 255 + VolumeFlowPeriod + 2 bars, and every value is computed once on closed-bar data.
🛠️ Using It in a Strategy
Smart Money Volume Index is most useful as a high-conviction filter — let other signals fire freely, but only act when NetIndex agrees. The example below uses it as a standalone trend gate: enter long when NetIndex crosses above the high-interest threshold, short on the symmetric crossing of its negative, and flip out when it returns to neutral.
Below is the lifecycle: instantiate in State.DataLoaded, then in OnBarUpdate watch for threshold crossings.
private SmartMoneyVolumeIndex smvi;
private double thr;

protected override void OnStateChange()
{
    if (State == State.SetDefaults)
    {
        Name = "SmartMoneyVolumeIndexStrategyExample";
    }
    else if (State == State.DataLoaded)
    {
        smvi = SmartMoneyVolumeIndex(
            SmartMoneyVolumeIndex_Mode.Net,    // Display Mode
            25,                                // Index Period
            14,                                // Volume Flow Period
            500,                               // Normalization Period
            0.9                                // High Interest Threshold
        );
        thr = 0.9;
    }
}

protected override void OnBarUpdate()
{
    if (CurrentBar < 520) return;  // Wait past RSI warmup + normalization peak

    double net0 = smvi.NetIndex[0];
    double net1 = smvi.NetIndex[1];

    bool armedLong  = net0 >  thr && net1 <=  thr;
    bool armedShort = net0 < -thr && net1 >= -thr;

    if (armedLong  && Position.MarketPosition != MarketPosition.Long)  EnterLong();
    if (armedShort && Position.MarketPosition != MarketPosition.Short) EnterShort();

    // Flat out when net interest decays back into neutral territory
    if (Position.MarketPosition == MarketPosition.Long  && net0 < 0) ExitLong();
    if (Position.MarketPosition == MarketPosition.Short && net0 > 0) ExitShort();
}
All three outputs are Series<>, so smvi.NetIndex[5] reads the value five bars ago. The Update() wrapper is inside each getter.
Public Outputs
| Output | Type | Description |
|---|---|---|
| IndexBuy[0] |
Series | Normalized buy interest in [0..1]. |
| IndexSell[0] |
Series | Normalized sell interest in [0..1]. |
| NetIndex[0] |
Series | IndexBuy − IndexSell, in [−1..1]. The single number to gate trend bias on. |
🔄 Conversion Notes
A few things changed in the translation from Pine Script to NinjaScript:
PVI / NVI implemented inline. NT8 has no built-in PVI/NVI primitive (Pine has direct functions), so both are implemented as recursive Series<double> seeded at 1.0, accumulated only on the matching volume direction, and used as inputs to a paired EMA for the detrend.
Heatmap fade as one SharpDX gradient column. Pine renders the per-bar heatmap fade as five stacked semi-transparent column plots. NT8 uses a single per-bar SharpDX gradient column in OnRender — same visual, no plot proliferation, and a single render path to maintain.
Zone fills above / below the threshold. Pine’s threshold band is implemented here as two full-width SharpDX gradient bands (above the high-interest threshold, below its negative). Brightness is driven by adaptive flags (topActive / botActive) computed in OnBarUpdate from the last bar’s signal.
Display Mode as an enum. Pine’s string-input switch is replaced with a typed C# enum (SmartMoneyVolumeIndex_Mode) so the property dialog renders a proper dropdown.
Bar coloring via BarBrushes from a sub-panel. Smart Money Volume Index lives below the price panel but recolors the price-panel candles. BarBrushes[0] + CandleOutlineBrushes[0] set the active candle color from inside the sub-panel indicator — no second indicator needed.
Series-based public outputs. IndexBuy, IndexSell, and NetIndex are all exposed as Series<double> with infinite lookback, so a strategy can index any of them back any number of bars.
📦 Download
The full source is available as a free NinjaScript Archive. To install:
- Download the
.zipfile below. - In NinjaTrader 8, go to Tools → Import → NinjaScript Add-On.
- Select the downloaded
.zipfile. - The indicator will appear under Indicators → indTradingView → Smart Money Volume Index [AlgoAlpha] on your chart.
📊 Chart Example
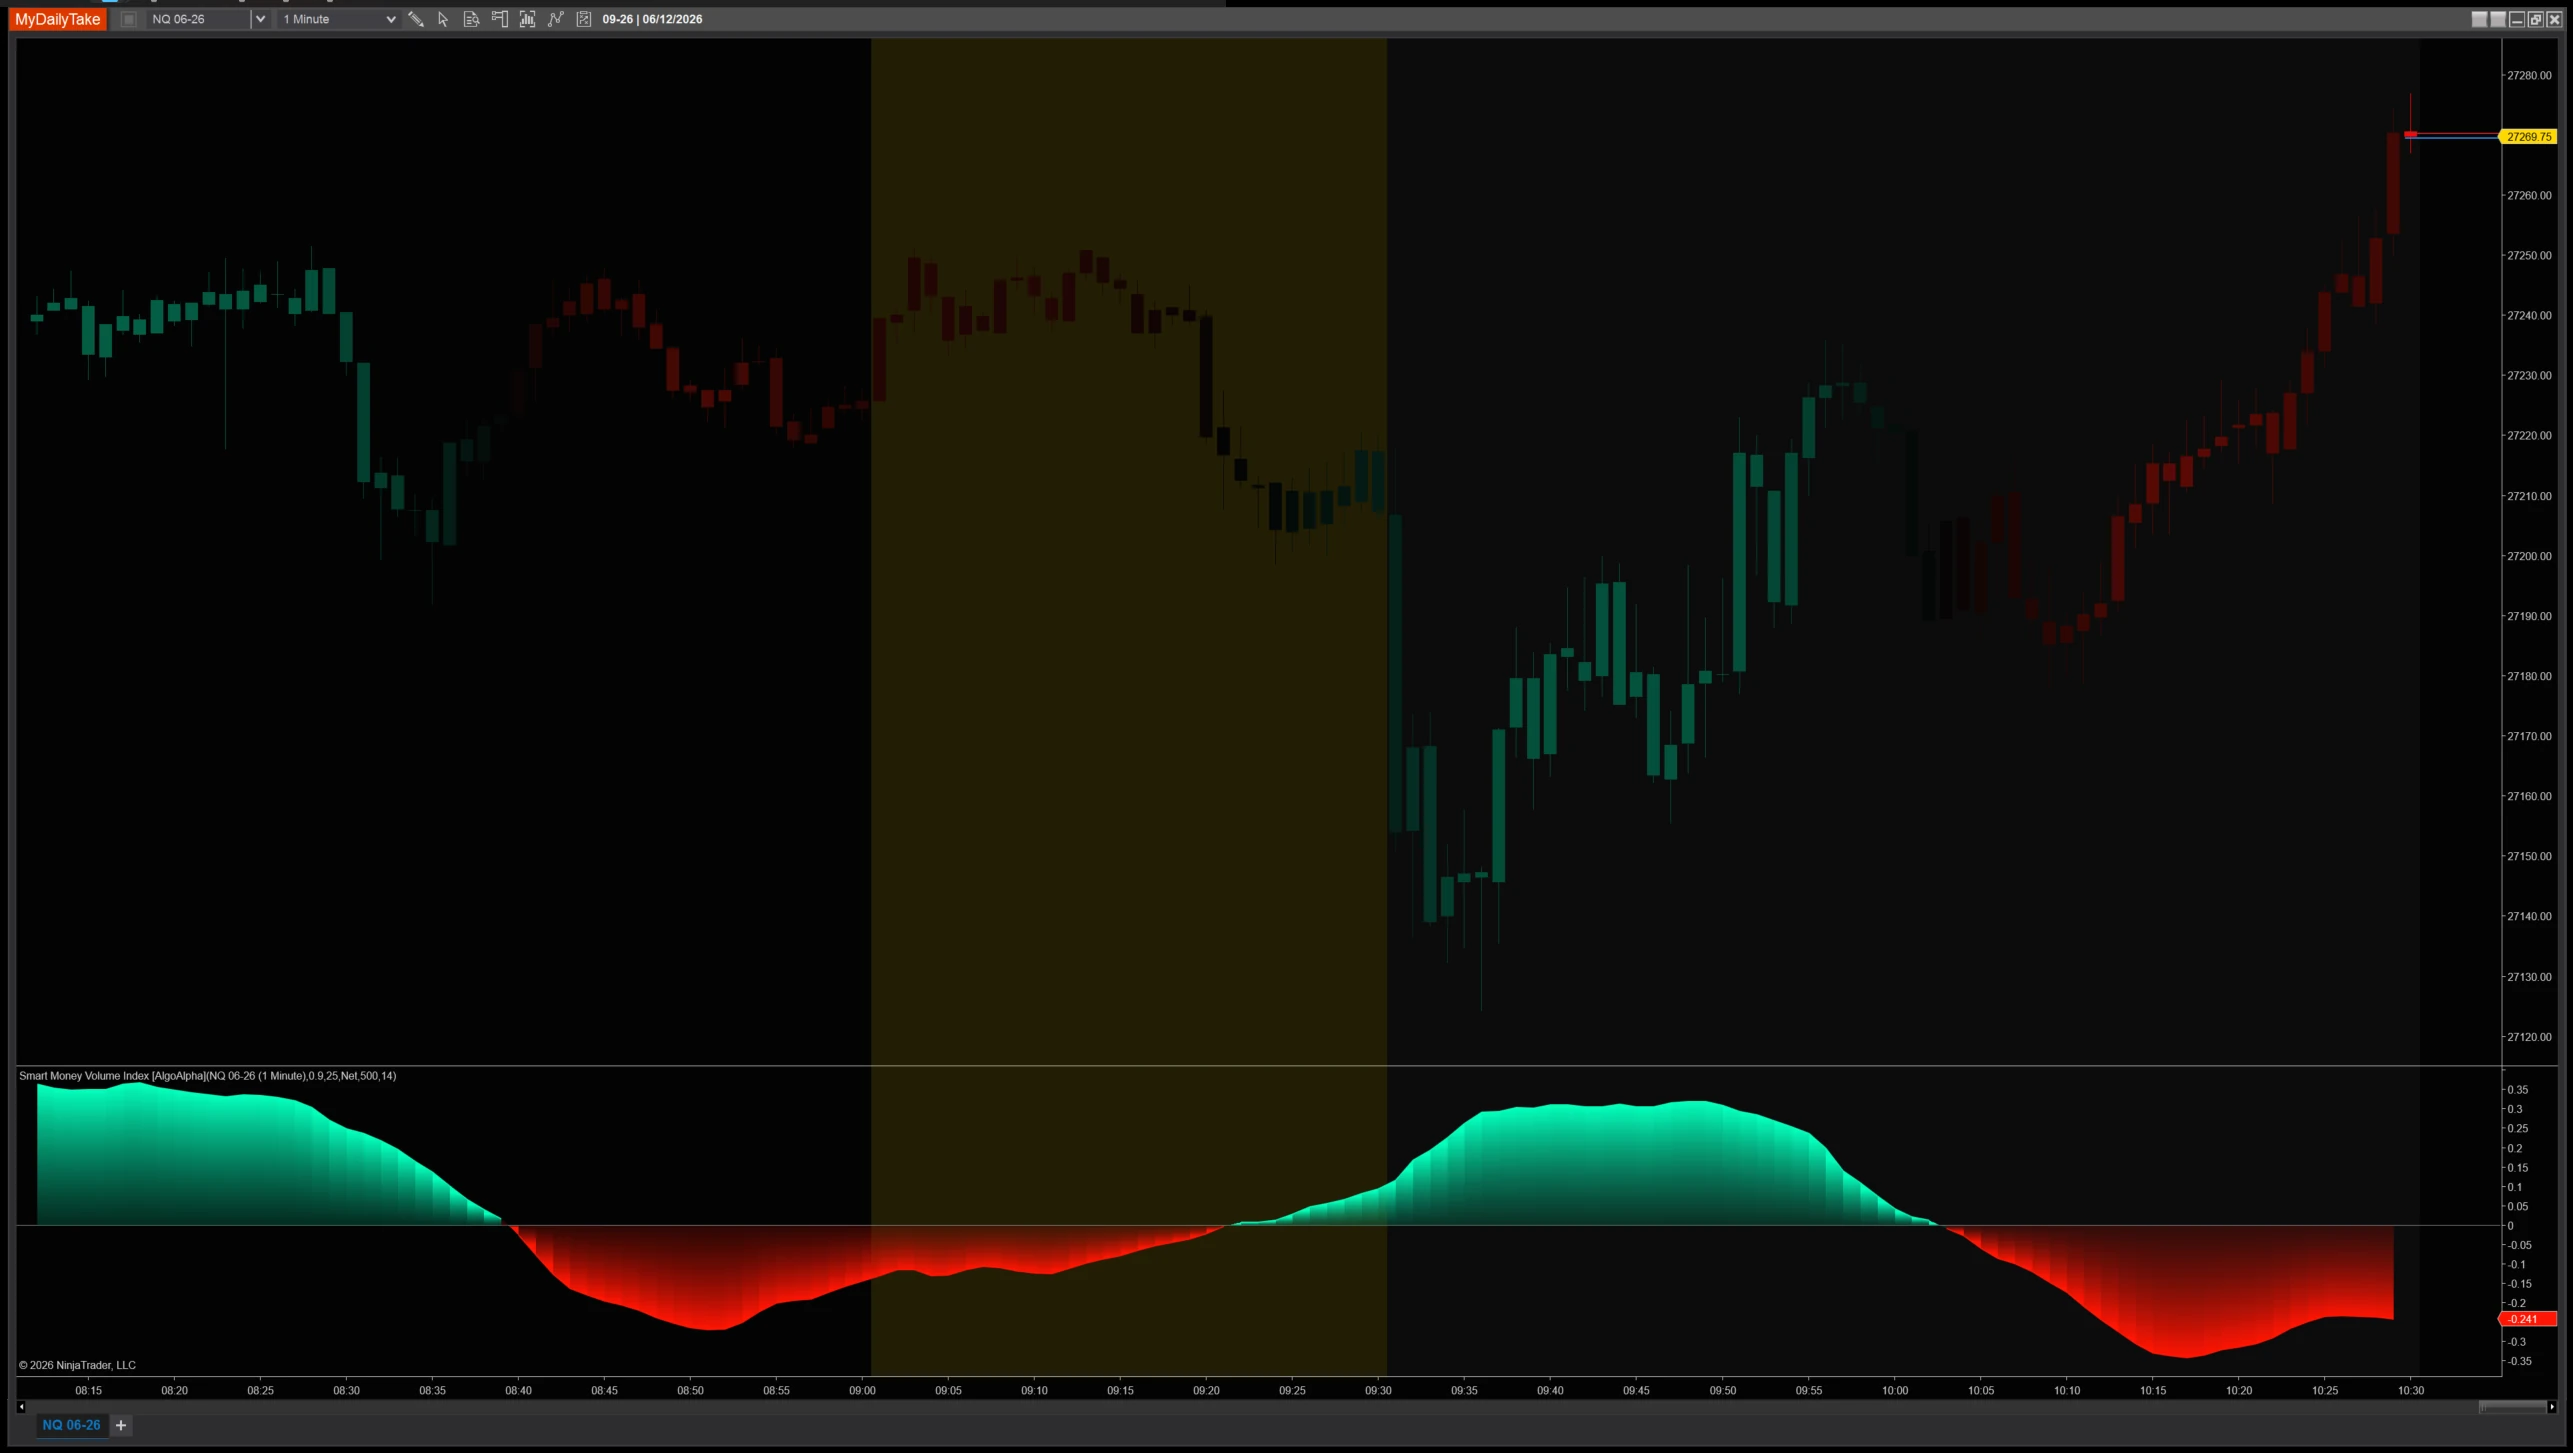
Smart Money Volume Index on a 1-minute chart in Net mode with default settings. The oscillator centers on zero and tilts up or down with the volume-distribution skew. The two gray bands above 0.9 and below −0.9 brighten when net interest enters the high-conviction zone, and the price-panel candles recolor to match — the chart itself signals when smart-money divergence is committing.


The original Pine Script™ code is by AlgoAlpha and is licensed under the Mozilla Public License 2.0 (MPL 2.0). This NinjaTrader 8 adaptation is by MyDailyTake.com. The use of AlgoAlpha’s name or adapted code does not imply endorsement by the original author.
