TradingView Inertial RSI [LuxAlgo] Conversion to NinjaTrader 8
LuxAlgo’s Inertial RSI is the RSI cousin of LuxAlgo’s Inertial Stochastic. Same idea: instead of one fixed lookback, scan every RMA-based RSI from MinLen to MaxLen on each closed bar, then pick the one whose value sits closest to the previous bar’s chosen value. The result is a Wilder-smoothed RSI that resists noise — it stays put unless a length confirms it has to move.
K = SMA of the inertia RSI; Signal = SMA of K. Cross-over above OsLevel fires a bullish triangle on the price panel; cross-under below ObLevel fires a bearish one. Bull / bear vertical gradient fills behind the lines (above 50 / below 50) keep the regime read at a glance.
This post is the NinjaTrader 8 conversion. The full source compiles standalone in indTradingView/, exposes the RSI line, the signal line, the raw inertia RSI, and the bull/bear cross flags as Series<> outputs for strategy use, and is yours to download as a NinjaScript Archive.
Original Pine Script: Inertial RSI by LuxAlgo
License: Mozilla Public License 2.0 (MPL 2.0)
🆚 What Makes Inertial RSI Different
Standard RSI on a fixed length flickers around its overbought / oversold thresholds in chop and lags every reversal in trends. Single-length parameter optimization solves one problem and creates the other. The inertia scan dodges both: every bar, every candidate length is computed simultaneously, and the indicator selects the value closest to its own prior reading.
Per-length RMA arrays. Each candidate length carries its own running RMA of gains and losses. So a length-10 RSI’s RMA isn’t the same as a length-20 RSI’s RMA — the indicator maintains MaxLen + 1 separate Wilder smoothers and reads each bar’s value from the matching slot. Output: a true ensemble of RMA-based RSIs.
Configurable OB/OS levels. Most stock RSI indicators hardcode 70 / 30. Inertial RSI exposes both — defaults are the tighter 60 / 40 because the inertia smoothing already removes a lot of the noise that wide thresholds were compensating for. Cross-overs through these levels fire the signal triangles.
Price-panel signal triangles. The indicator lives below the price panel but draws bull / bear triangles directly on the price panel via DrawOnPricePanel = true. So you don’t have to context-switch between the oscillator and the chart — the signals print where you’re looking.
⚙️ Settings
Inertial RSI exposes its inputs in two property groups: the calculation parameters (length scan range, smoothing, OB / OS levels), and the visuals group with the gradient-fill toggle, signal-triangle toggle, and bull / bear colors.
Settings
| Parameter | Default | Description |
|---|---|---|
| Minimum Length | 10 | Smallest RSI length the inertia scan considers. |
| Maximum Length | 40 | Largest RSI length the inertia scan considers (capped at 256 for default Series lookback compatibility). |
| RSI Smoothing | 3 | SMA length applied to the inertia RSI to produce the RSI line. |
| Signal Line Length | 14 | SMA length applied to the RSI line to produce the signal line. |
| Overbought Level | 60 | Cross-under fires a bearish signal triangle. |
| Oversold Level | 40 | Cross-over fires a bullish signal triangle. |
Visuals
| Parameter | Default | Description |
|---|---|---|
| Show Gradient Fill | True | Render the bullish / bearish vertical gradient fills. |
| Show Signal Triangles | True | Bull / bear triangles on the price panel at OS / OB cross events. |
| Bullish Color | #089981 | RSI line, gradient, and bullish triangles above 50. |
| Bearish Color | #F23645 | RSI line, gradient, and bearish triangles below 50. |
🧠 How It Works
Each bar runs the per-length RMA updates, picks the inertia-best RSI, smooths it, and computes the signal line and cross flags.
- Per-length RMA gains and losses. Maintain MaxLen + 1 RMA-of-gain and RMA-of-loss running averages. On each bar, every length’s RMA is updated with the same gain / loss inputs but its own alpha (1 / length). This is the Wilder RSI’s smoothing kernel, replicated across the whole length scan.
- Multi-length RSI candidates. For each length from MinLen to MaxLen, compute %RSI = 100 − 100 / (1 + RMA(gains) / RMA(losses)). Each candidate sits at a different sensitivity-vs-noise tradeoff.
- Inertia selection. Of all candidate %RSI values, pick the one whose absolute distance from the previous bar’s inertial RSI is smallest. That length’s RSI becomes the new inertial RSI — the Last Visited value. Inertia keeps the indicator from chasing every length’s individual flicker.
- RSI and Signal smoothing. RsiLine = SMA(inertial RSI, Smooth). SignalLine = SMA(RsiLine, SignalLen). Defaults 3 and 14 give a clean primary line with a slower confirming signal.
- Cross-flag detection. BullSignal[0] = true on the bar where RsiLine crosses up through OsLevel. BearSignal[0] = true on the bar where RsiLine crosses down through ObLevel. Both are exposed as
Series<bool>for strategy consumers. - Visual layer. SharpDX vertical gradient fills (bull above 50, bear below) are drawn using the canonical
LinearGradientBrushtemplate. Bull / bear triangles render on the price panel viaDrawOnPricePanel = trueon the cross bar. OB / OS reference lines use dynamicDraw.HorizontalLineso user-configured levels render correctly.
The indicator is non-repainting. Per-length RMA updates and the inertia selection use only closed-bar history.
🛠️ Using It in a Strategy
Inertial RSI’s most natural strategy use is event-driven via the BullSignal / BearSignal flags — enter on the cross-event, exit on the opposite cross or on RSI returning to the midline. The example below uses both flags as the entry trigger and reads the RsiLine for an exit.
Below is the lifecycle: instantiate in State.DataLoaded, then in OnBarUpdate watch for the cross flags.
private InertialRsi irsi;

protected override void OnStateChange()
{
    if (State == State.SetDefaults)
    {
        Name = "InertialRsiStrategyExample";
    }
    else if (State == State.DataLoaded)
    {
        irsi = InertialRsi(
            10,    // Minimum Length
            40,    // Maximum Length
            3,     // RSI Smoothing
            14,    // Signal Line Length
            60.0,  // Overbought Level
            40.0,  // Oversold Level
            true,  // Show Gradient Fill
            true   // Show Signal Triangles
        );
    }
}

protected override void OnBarUpdate()
{
    if (CurrentBar < 60) return;

    if (irsi.BullSignal[0] && Position.MarketPosition != MarketPosition.Long)
        EnterLong();

    if (irsi.BearSignal[0] && Position.MarketPosition != MarketPosition.Short)
        EnterShort();

    // Exit on RSI returning to the midline
    if (Position.MarketPosition == MarketPosition.Long  && irsi.RsiLine[0] < 50.0) ExitLong();
    if (Position.MarketPosition == MarketPosition.Short && irsi.RsiLine[0] > 50.0) ExitShort();
}
Both flag series are Series<bool>, so reading irsi.BullSignal[1] tells you the cross fired one bar ago — useful if you want to act on the next bar’s open instead of the close.
Public Outputs
| Output | Type | Description |
|---|---|---|
| RsiLine[0] |
Series | SMA-smoothed inertia RSI. Primary line, bull / bear colored above / below 50. |
| SignalLine[0] |
Series | SMA of the RSI line. The signal line. |
| InertialRsiSeries[0] |
Series | Raw inertia-selected RSI before smoothing. The Last Visited value. |
| BullSignal[0] |
Series | True on the bar where RSI crosses up through OsLevel. |
| BearSignal[0] |
Series | True on the bar where RSI crosses down through ObLevel. |
🔄 Conversion Notes
A few things changed in the translation from Pine Script to NinjaScript:
Per-length RMA arrays. Pine maintains an array of ta.rma calls inside a loop. NT8’s RSI primitive doesn’t expose its RMA state to a multi-length scan, so the conversion implements a double[] of RMA-of-gains and RMA-of-losses sized MaxLen + 1, updated per bar with the matching alpha.
MaxLen capped at 256. Pine has no internal series-lookback cap. NT8’s default Series<> lookback is 256. To keep the inner-loop reads on the default lookback (rather than forcing all per-length series to Infinite, which has memory implications), MaxLen is capped at 256 in the property’s Range attribute.
Configurable OB/OS as dynamic Draw.HorizontalLine. Pine’s hline() is a draw-time fixed level. The conversion uses Draw.HorizontalLine with the 7-arg dashed signature so the rendered OB / OS lines update when the user changes the level via the property dialog.
Vertical gradient fill via SharpDX LinearGradientBrush. The bull / bear gradient fills behind the RSI line use the canonical SharpDX template — GradientStopCollection built once in OnRenderTargetChanged, brush rebuilt per render frame because Y coords depend on chartScale.
Price-panel signal triangles. DrawOnPricePanel = true lets the sub-panel indicator drop its bull / bear triangle markers directly on the price panel via Draw.TriangleUp / Draw.TriangleDown at the cross bar.
Series-based public outputs. Five outputs are exposed: RsiLine, SignalLine, InertialRsiSeries (the raw pre-smooth inertia value), BullSignal, BearSignal. Strategies can mix continuous-line reads with event-based cross flags.
📦 Download
The full source is available as a free NinjaScript Archive. To install:
- Download the
.zipfile below. - In NinjaTrader 8, go to Tools → Import → NinjaScript Add-On.
- Select the downloaded
.zipfile. - The indicator will appear under Indicators → indTradingView → Inertial RSI [LuxAlgo] on your chart.
📊 Chart Example
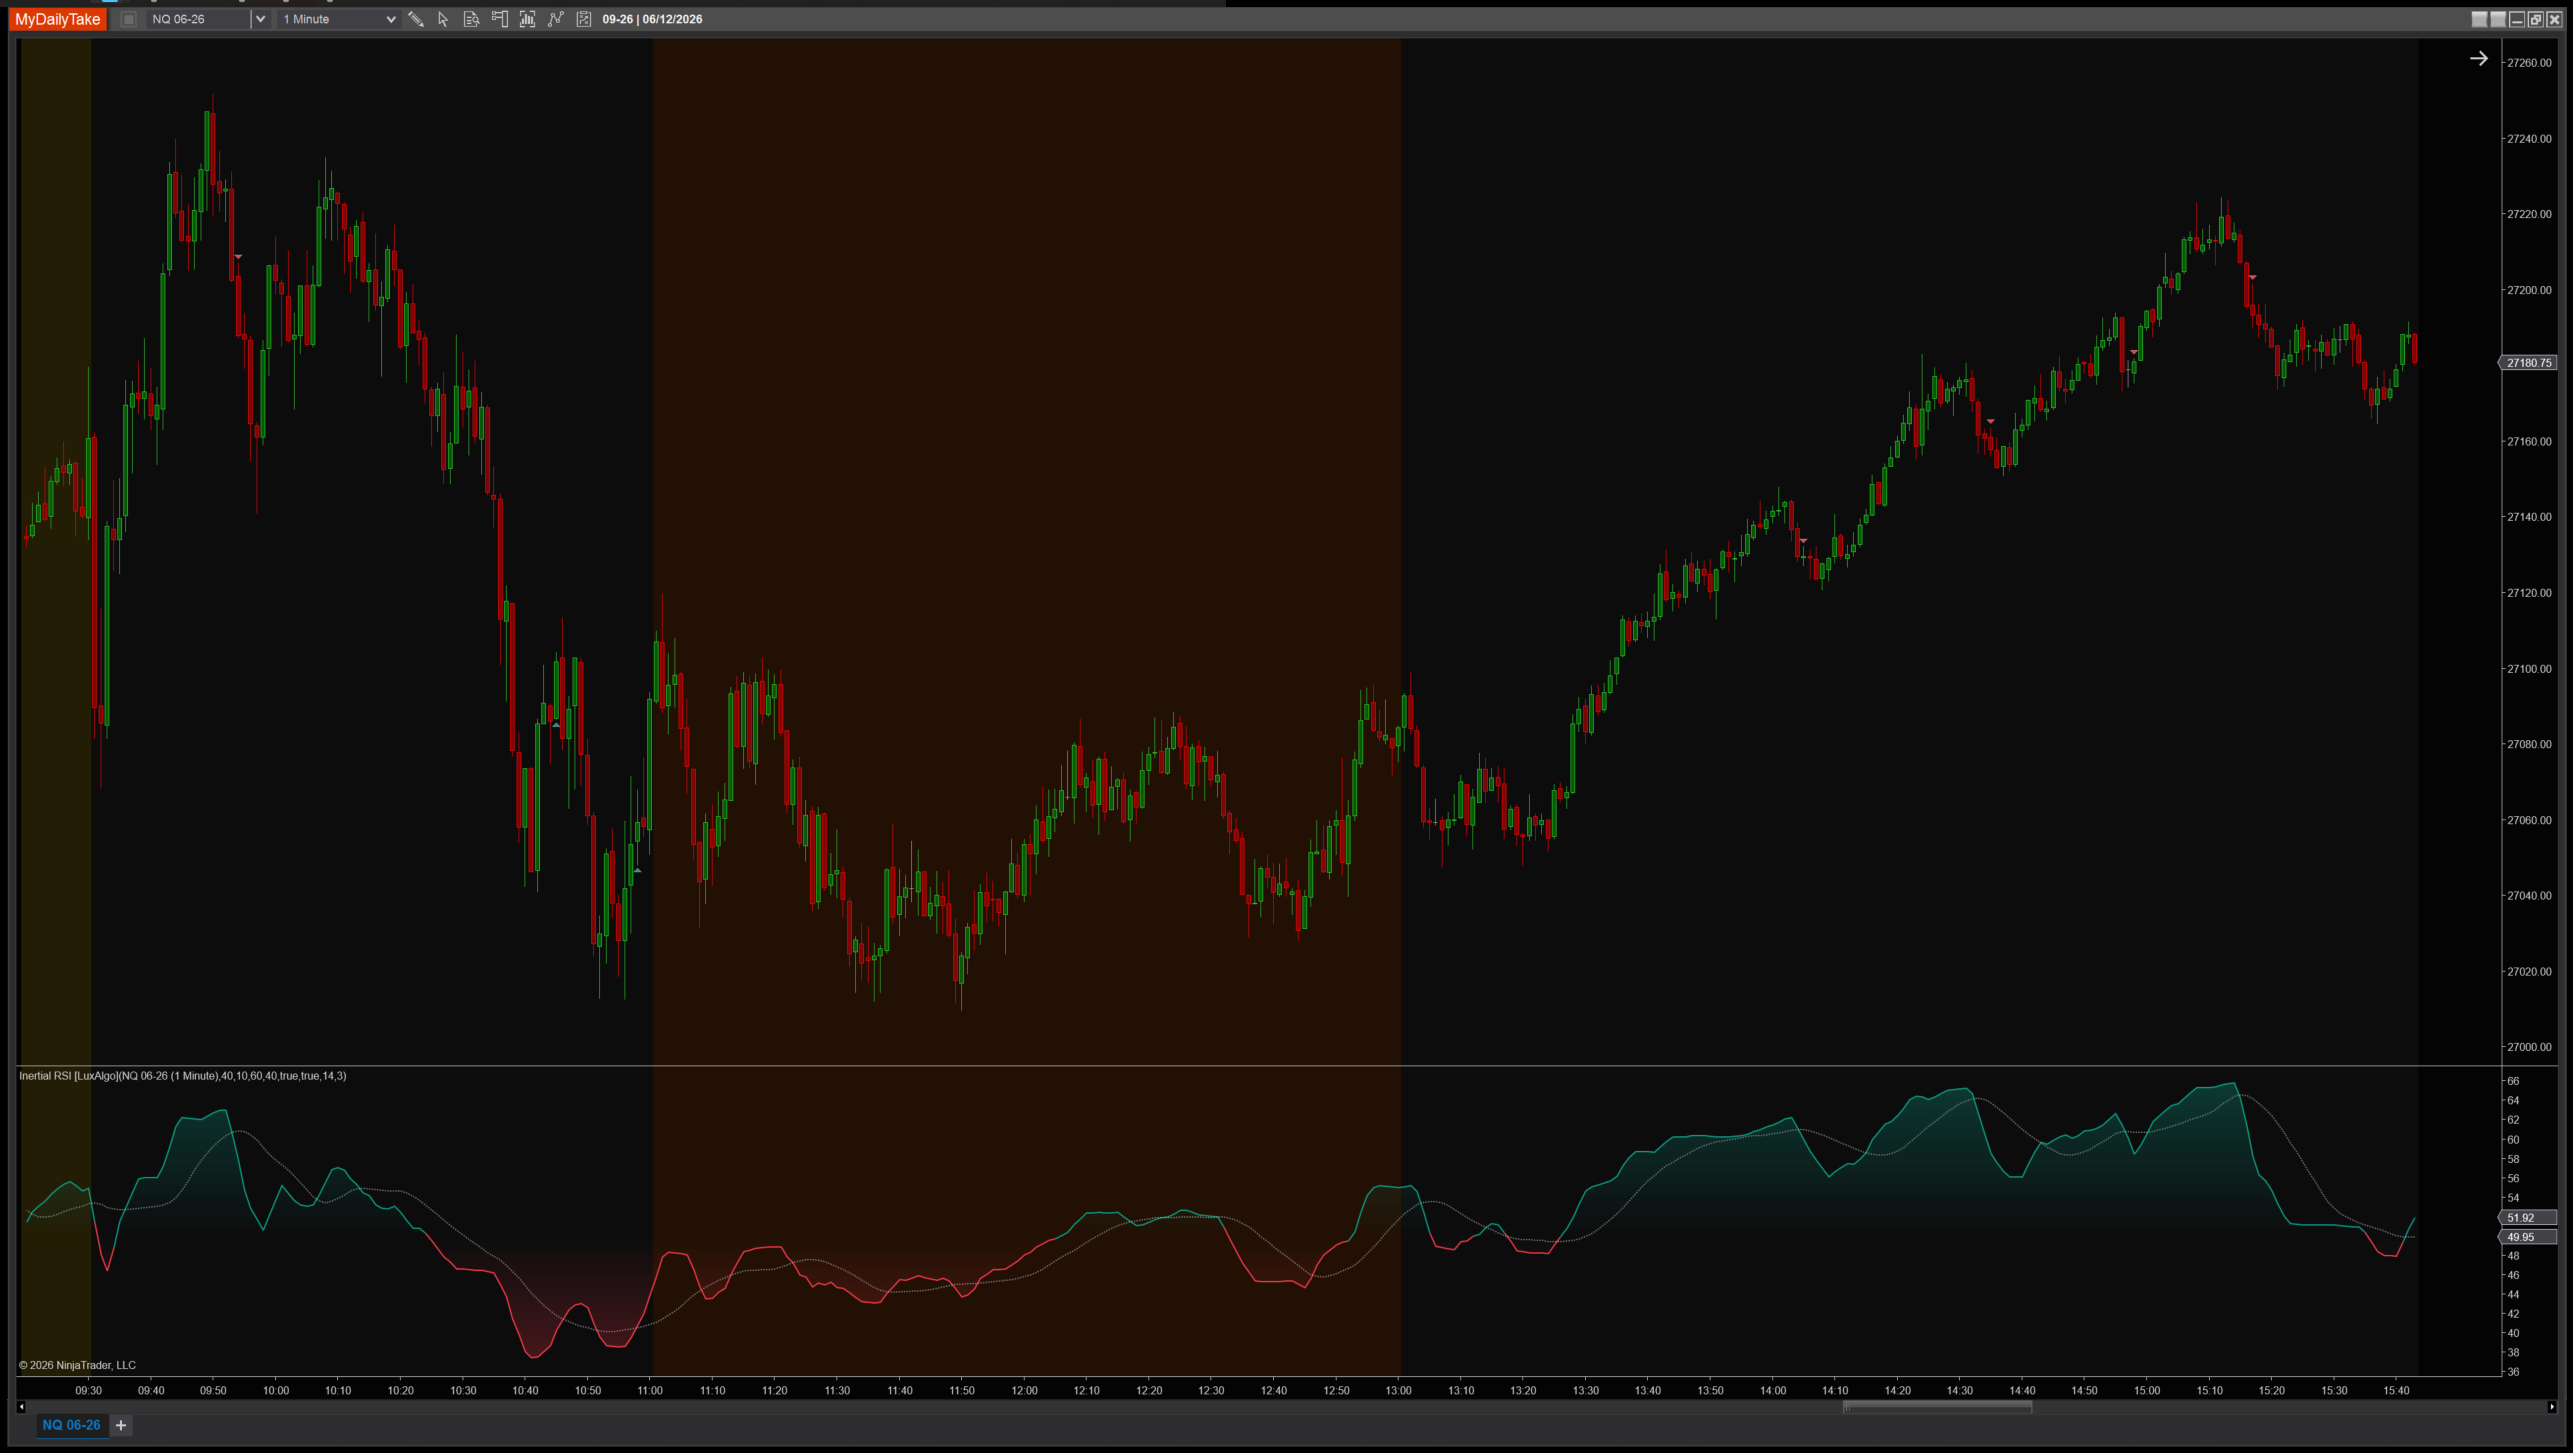
Inertial RSI on a 1-minute chart with default settings (Min=10, Max=40, Smooth=3, Signal=14). The RSI line glides through extremes with the inertia scan dampening noise. Bull / bear vertical gradient fills behind the lines tint the panel above 50 and below 50. Triangles drop on the price panel at OS / OB cross-overs — the chart shows the entry without needing to look at the oscillator.


The original Pine Script™ code is by LuxAlgo and is licensed under the Mozilla Public License 2.0 (MPL 2.0). This NinjaTrader 8 adaptation is by MyDailyTake.com. The use of LuxAlgo’s name or adapted code does not imply endorsement by the original author.