TradingView SuperTrend Oscillator [ChartPrime] Conversion to NinjaTrader 8
SuperTrend gives you a binary trend signal: above the band or below it. ChartPrime’s SuperTrend Oscillator turns the same primitive into a graded momentum read by measuring the distance from price to the SuperTrend line, smoothing it, and normalizing — turning a yes/no flip into a continuous oscillator that swings roughly in ±1.7.
The result is an oscillator with bull/bear gradient fills, translucent upper/lower zone tints, and a per-bar color flow that runs from bear at −1, through neutral at 0, to bull at +1. Reversal diamonds fire when the oscillator crosses its 3-bar prior value past ±0.5 — strong internal-momentum reversal flags, with a 10-bar refractory window to dedupe.
This post is the NinjaTrader 8 conversion. The full source compiles standalone in indTradingView/, exposes the oscillator value, the SuperTrend line, and the trend direction as Series<> outputs for strategy use, and is yours to download as a NinjaScript Archive.
Original Pine Script: SuperTrend Oscillator by ChartPrime
License: Mozilla Public License 2.0 (MPL 2.0)
🆚 What Makes SuperTrend Oscillator Different
Standard SuperTrend tells you direction. SuperTrend Oscillator tells you direction and conviction. The numeric distance from close to the SuperTrend band carries information that the binary flip discards — a price hugging the band versus a price 4 ATRs above it are very different states, but they read identically on the standard indicator.
HMA / SMA / EMA smoothing. The (Close − SuperTrend) raw signal is jagged. The Oscillator Type setting picks the smoother — HMA for the cleanest visual (default), SMA for a heavier average, EMA for traditional weighting. Each gives a different feel: HMA is most responsive, SMA most stable.
Reversal diamonds with a refractory. A diamond drops when the oscillator crosses its value from 3 bars ago AND the absolute value is past 0.5 — a strong momentum-shift filter. A 10-bar refractory keeps the diamond from re-firing during a noisy zone, so each marker is a single committed event.
⚙️ Settings
SuperTrend Oscillator exposes its inputs in three property groups: the SuperTrend math, the oscillator’s smoothing setup, and the appearance brushes for the gradient color flow.
SuperTrend
| Parameter | Default | Description |
|---|---|---|
| ATR Multiplier | 4.0 | Multiplier applied to ATR to size the SuperTrend bands. |
| ATR Length | 100 | ATR period used for both the SuperTrend and the oscillator's normalization. |
Oscillator
| Parameter | Default | Description |
|---|---|---|
| Oscillator Type | HMA | MA type used to smooth (Close − SuperTrend). HMA = sharpest, SMA = heaviest, EMA = traditional. |
| Oscillator Smoothing | 25 | Lookback for the smoothing MA. |
Appearance
| Parameter | Default | Description |
|---|---|---|
| Bullish Color | #FFDFB9 | Upper-zone gradient and bullish bar / oscillator coloring. |
| Bearish Color | #E24D3F | Lower-zone gradient and bearish bar / oscillator coloring. |
| Neutral Color | Gray | Mid-gradient color when the oscillator is near zero. |
🧠 How It Works
Each bar runs the SuperTrend math, then computes a smoothed and normalized distance from price to the band.
- Inline SuperTrend. Compute HL2 ± Multiplier × ATR(AtrLength). Apply standard band-locking — upper band ratchets only down in a downtrend, lower band ratchets only up in an uptrend. Trend flips when close crosses the active band.
- Distance from price. Subtract the SuperTrend value from close. The raw difference flips sign with the trend and grows / shrinks with how far price has run from the band.
- Smoothing. Run the Oscillator Type MA (HMA, SMA, or EMA) over the difference for OscillatorSmooth bars. HMA is the default for its sharp response without the lag of an SMA.
- Normalization. Divide the smoothed difference by Multiplier × ATR. The output lands in roughly ±1.7 (the SuperTrend band sits at ±Multiplier × ATR, but smoothing reduces the magnitude). The dotted ±1.7 reference lines mark this expected envelope.
- Color flow. A linear gradient from BearColor at −1 through NeutralColor at 0 to BullColor at +1 paints the oscillator line, the price-panel candles, and the candle outlines — every visual cue is driven by the same scalar.
- Zone fills. SharpDX gradient bands fill the upper zone (between 0 and 1) in the bull color and the lower zone (between 0 and −1) in the bear color, capped at ±1 to keep the screen tidy. The translucent ±1.7 zone tints sit above and below for the rare overshoot.
- Reversal diamonds. A diamond fires when the oscillator crosses its osc[3] value AND |osc| > 0.5. A 10-bar refractory window prevents repeated firings inside the same noisy area.
The indicator is non-repainting — SuperTrend uses the standard band-lock pattern, and every value is computed once on closed-bar data.
🛠️ Using It in a Strategy
SuperTrend Oscillator’s most natural strategy use is as a momentum-confirmation gate on top of a standard SuperTrend. The example below enters on Direction flips, but only takes the trade when the oscillator’s magnitude shows there’s actually energy in the move — small-distance flips get filtered out.
Below is the lifecycle: instantiate in State.DataLoaded, then in OnBarUpdate watch for direction flips with oscillator confirmation.
private SuperTrendOscillator sto;

protected override void OnStateChange()
{
    if (State == State.SetDefaults)
    {
        Name = "SuperTrendOscillatorStrategyExample";
    }
    else if (State == State.DataLoaded)
    {
        sto = SuperTrendOscillator(
            4.0,                                       // ATR Multiplier
            100,                                       // ATR Length
            SuperTrendOscillator_OscType.HMA,          // Oscillator Type
            25                                         // Oscillator Smoothing
        );
    }
}

protected override void OnBarUpdate()
{
    if (CurrentBar < 150) return;

    bool flippedUp   = sto.Direction[0] ==  1 && sto.Direction[1] != 1;
    bool flippedDown = sto.Direction[0] == -1 && sto.Direction[1] != -1;

    // Only act on flips that have momentum behind them: |osc| past 0.5.
    bool osConfirmsLong  = sto.Oscillator[0] >  0.5;
    bool osConfirmsShort = sto.Oscillator[0] < -0.5;

    if (flippedUp && osConfirmsLong)
    {
        EnterLong();
        SetStopLoss(CalculationMode.Price, sto.SuperTrend[0]);
    }
    if (flippedDown && osConfirmsShort)
    {
        EnterShort();
        SetStopLoss(CalculationMode.Price, sto.SuperTrend[0]);
    }

    // Trail along the active SuperTrend band
    if (Position.MarketPosition == MarketPosition.Long)
        SetStopLoss(CalculationMode.Price, sto.SuperTrend[0]);
    else if (Position.MarketPosition == MarketPosition.Short)
        SetStopLoss(CalculationMode.Price, sto.SuperTrend[0]);
}
All three outputs are Series<>, so sto.Oscillator[5] reads the value five bars ago and sto.SuperTrend[0] is usable as a trailing stop level.
Public Outputs
| Output | Type | Description |
|---|---|---|
| Oscillator[0] |
Series | Normalized momentum oscillator. Roughly ±1.7 — bull territory above 0, bear below. |
| SuperTrend[0] |
Series | Inline SuperTrend band value. Usable as a trailing stop. |
| Direction[0] |
Series | 1 in an uptrend, −1 in a downtrend. |
🔄 Conversion Notes
A few things changed in the translation from Pine Script to NinjaScript:
Inline HMA, SMA, EMA switch. Pine’s switch over MA function names becomes a typed C# enum (SuperTrendOscillator_OscType) plus a per-bar branch that runs the matching smoother. The HMA path uses an inline WMA-of-WMA recurrence rather than calling NT8’s HMA primitive, so the same code path covers all three modes.
SuperTrend implemented inline. NT8 has its own SuperTrend primitive but this conversion implements the band-locking recurrence directly so the trend line is exposed as a Series<double> output for strategy use.
Gradient zone fills via SharpDX trapezoids. Pine’s 6-arg fill(p1, p2, top, bot, c1, c2) calls render here as SharpDX gradient-brush trapezoids stitched between adjacent bars, with stops built once in OnRenderTargetChanged.
Per-bar color flow on the oscillator line. The line color comes from a 3-stop linear gradient (BearColor → NeutralColor → BullColor) sampled by the current oscillator value. PlotBrushes[0][0] takes the sampled brush each bar, so the line itself reads as a momentum heatmap.
Bar coloring on the price panel. Even though the oscillator lives below the price panel, BarBrushes and CandleOutlineBrushes recolor the price-panel candles in the same momentum-tinted color — no second indicator needed.
Documented scope drop: the SuperTrend line + fill rendered on the price panel itself is omitted. NT8 sub-panel indicators can’t draw arbitrary SharpDX geometry on the price panel, but the bar-color flow preserves the trend cue. SuperTrend is exposed as a Series<double> if a host indicator wants to plot it.
📦 Download
The full source is available as a free NinjaScript Archive. To install:
- Download the
.zipfile below. - In NinjaTrader 8, go to Tools → Import → NinjaScript Add-On.
- Select the downloaded
.zipfile. - The indicator will appear under Indicators → indTradingView → SuperTrend Oscillator [ChartPrime] on your chart.
📊 Chart Example
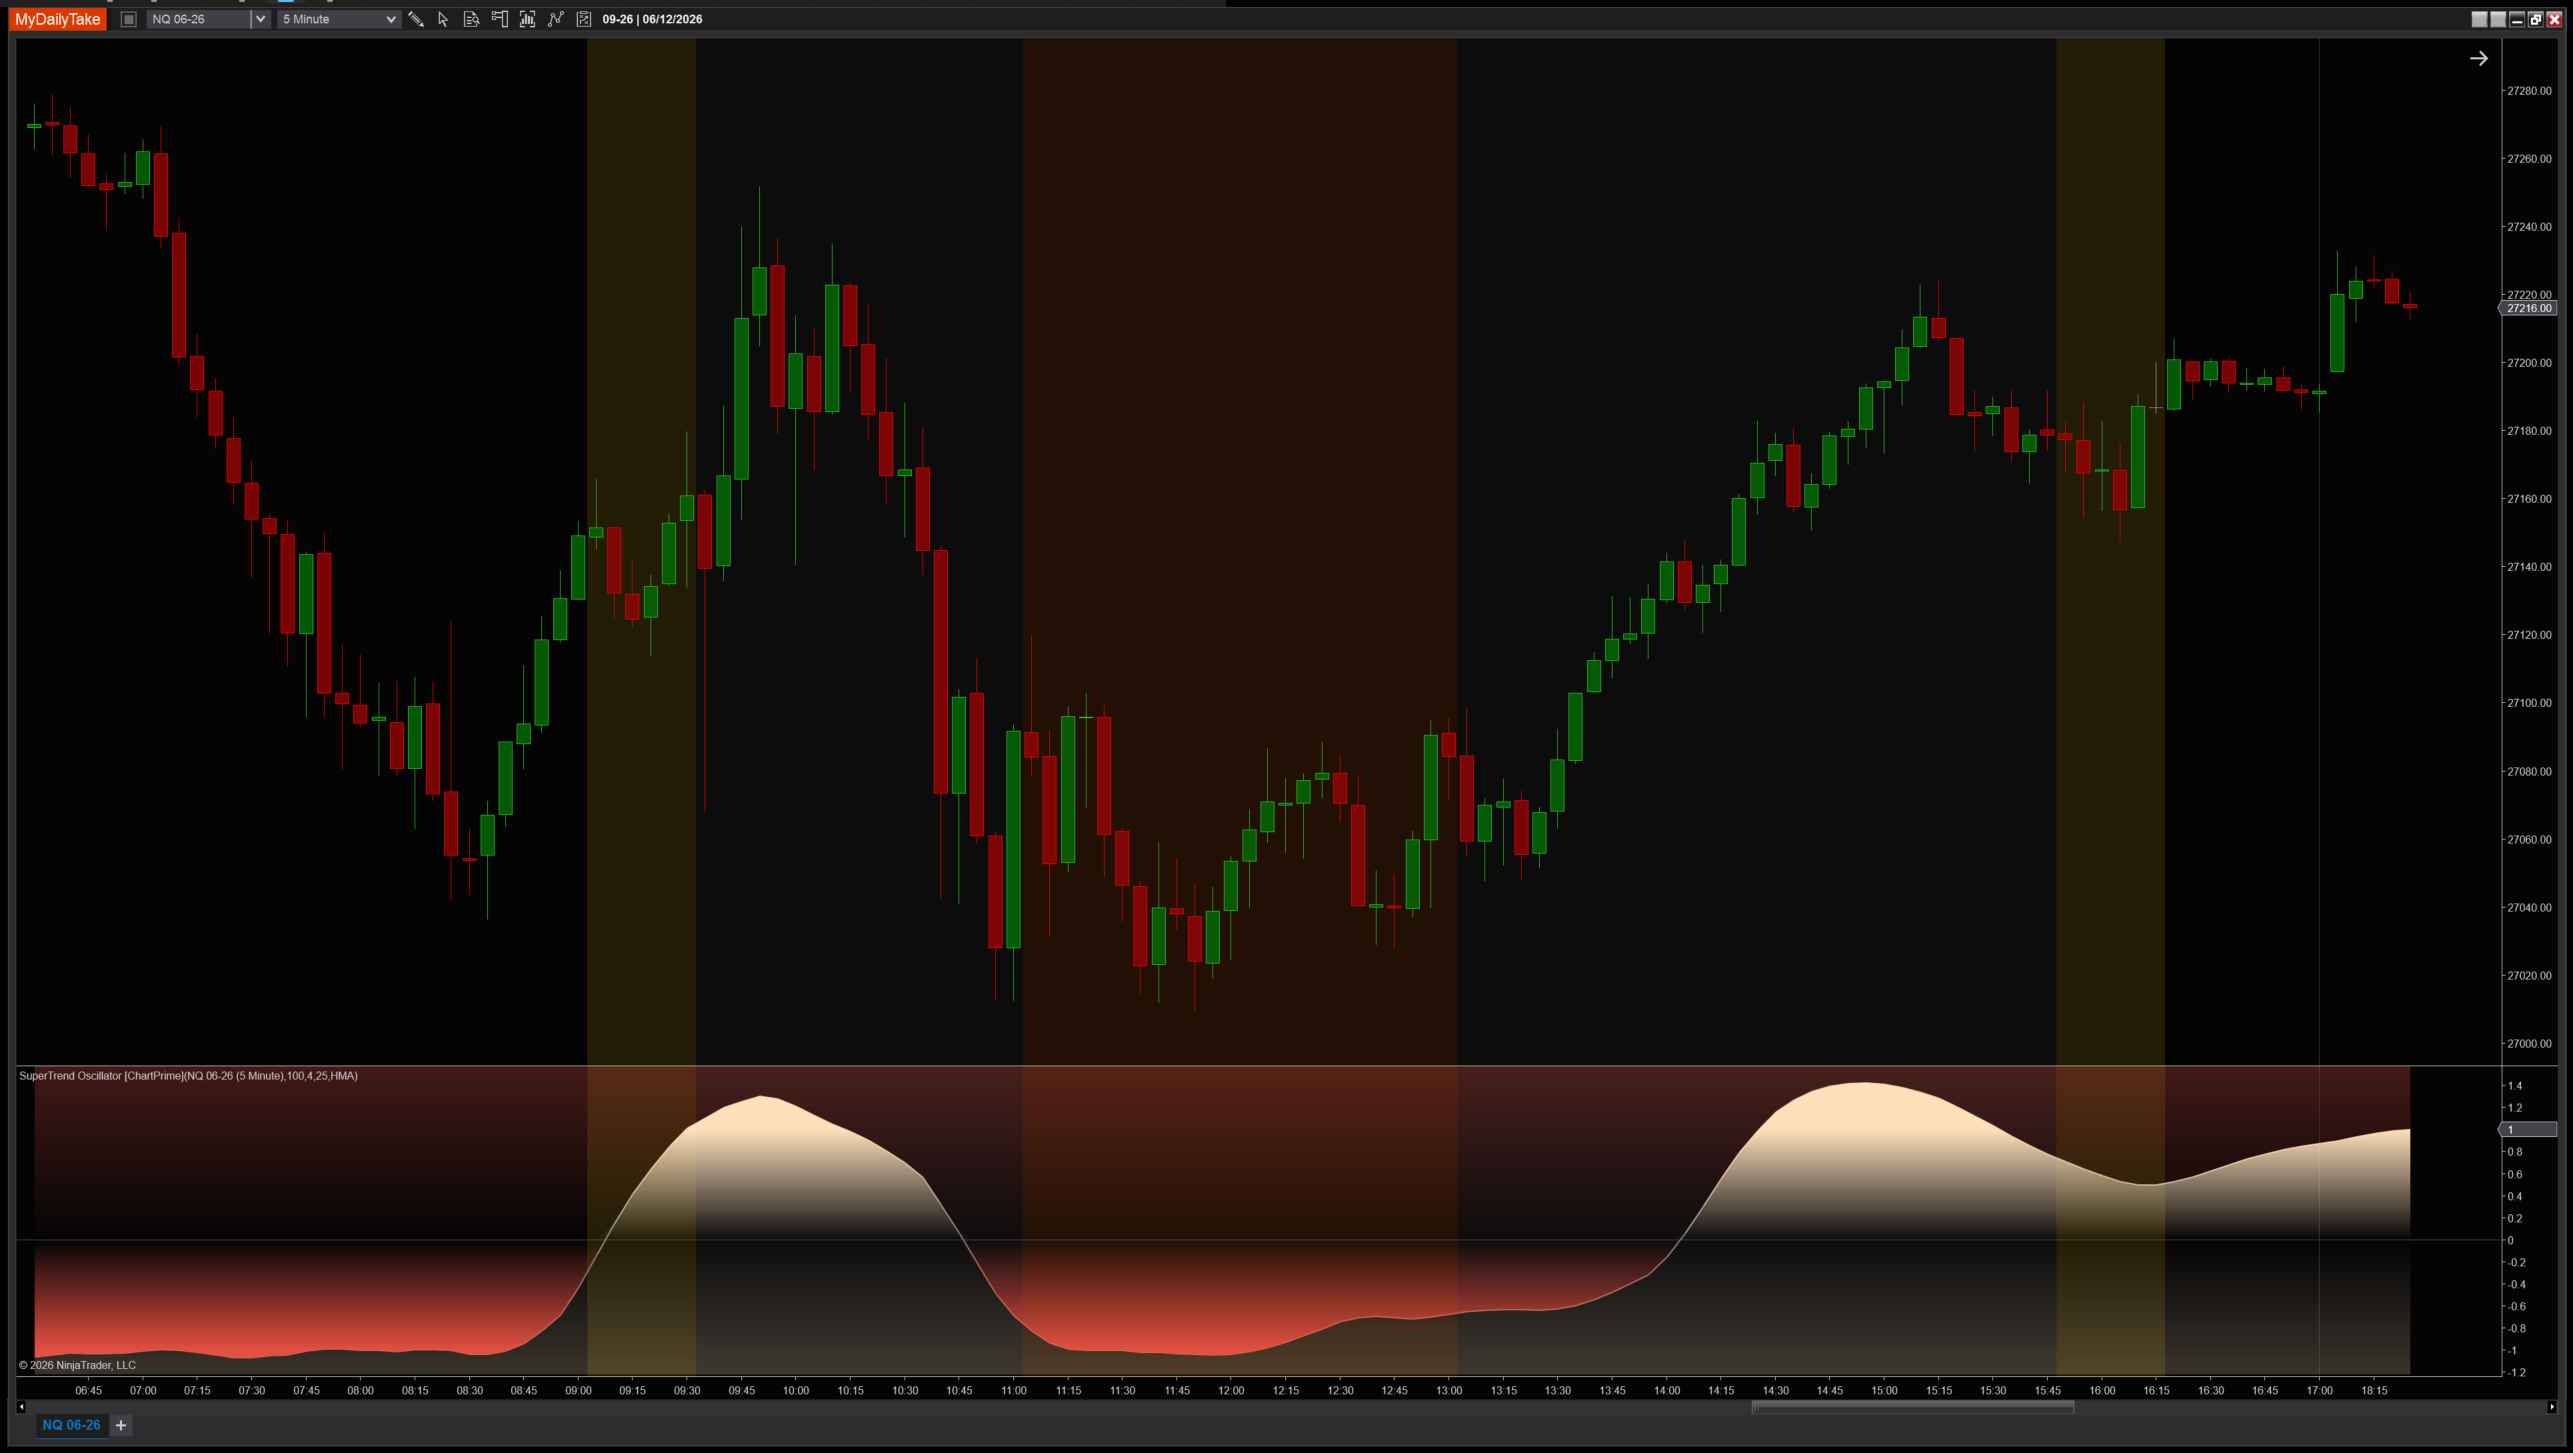
SuperTrend Oscillator on a 1-minute chart with default settings (Mult=4, ATR=100, HMA-25). The oscillator swings smoothly through ±1.7 with translucent upper / lower zones tinted in bull and bear colors. Diamonds drop on confirmed momentum reversals, and the price-panel candles recolor in the same gradient — close-to-zero is gray, deep bull is peach, deep bear is red.


The original Pine Script™ code is by ChartPrime and is licensed under the Mozilla Public License 2.0 (MPL 2.0). This NinjaTrader 8 adaptation is by MyDailyTake.com. The use of ChartPrime’s name or adapted code does not imply endorsement by the original author.